Turn on suggestions
Auto-suggest helps you quickly narrow down your search results by suggesting possible matches as you type.
Cancel
- Home
- :
- All Communities
- :
- Developers
- :
- JavaScript Maps SDK
- :
- JavaScript Maps SDK Questions
- :
- Re: Select by polygon 4.14
Options
- Subscribe to RSS Feed
- Mark Topic as New
- Mark Topic as Read
- Float this Topic for Current User
- Bookmark
- Subscribe
- Mute
- Printer Friendly Page
03-12-2020
05:41 AM
- Mark as New
- Bookmark
- Subscribe
- Mute
- Subscribe to RSS Feed
- Permalink
Hi guys
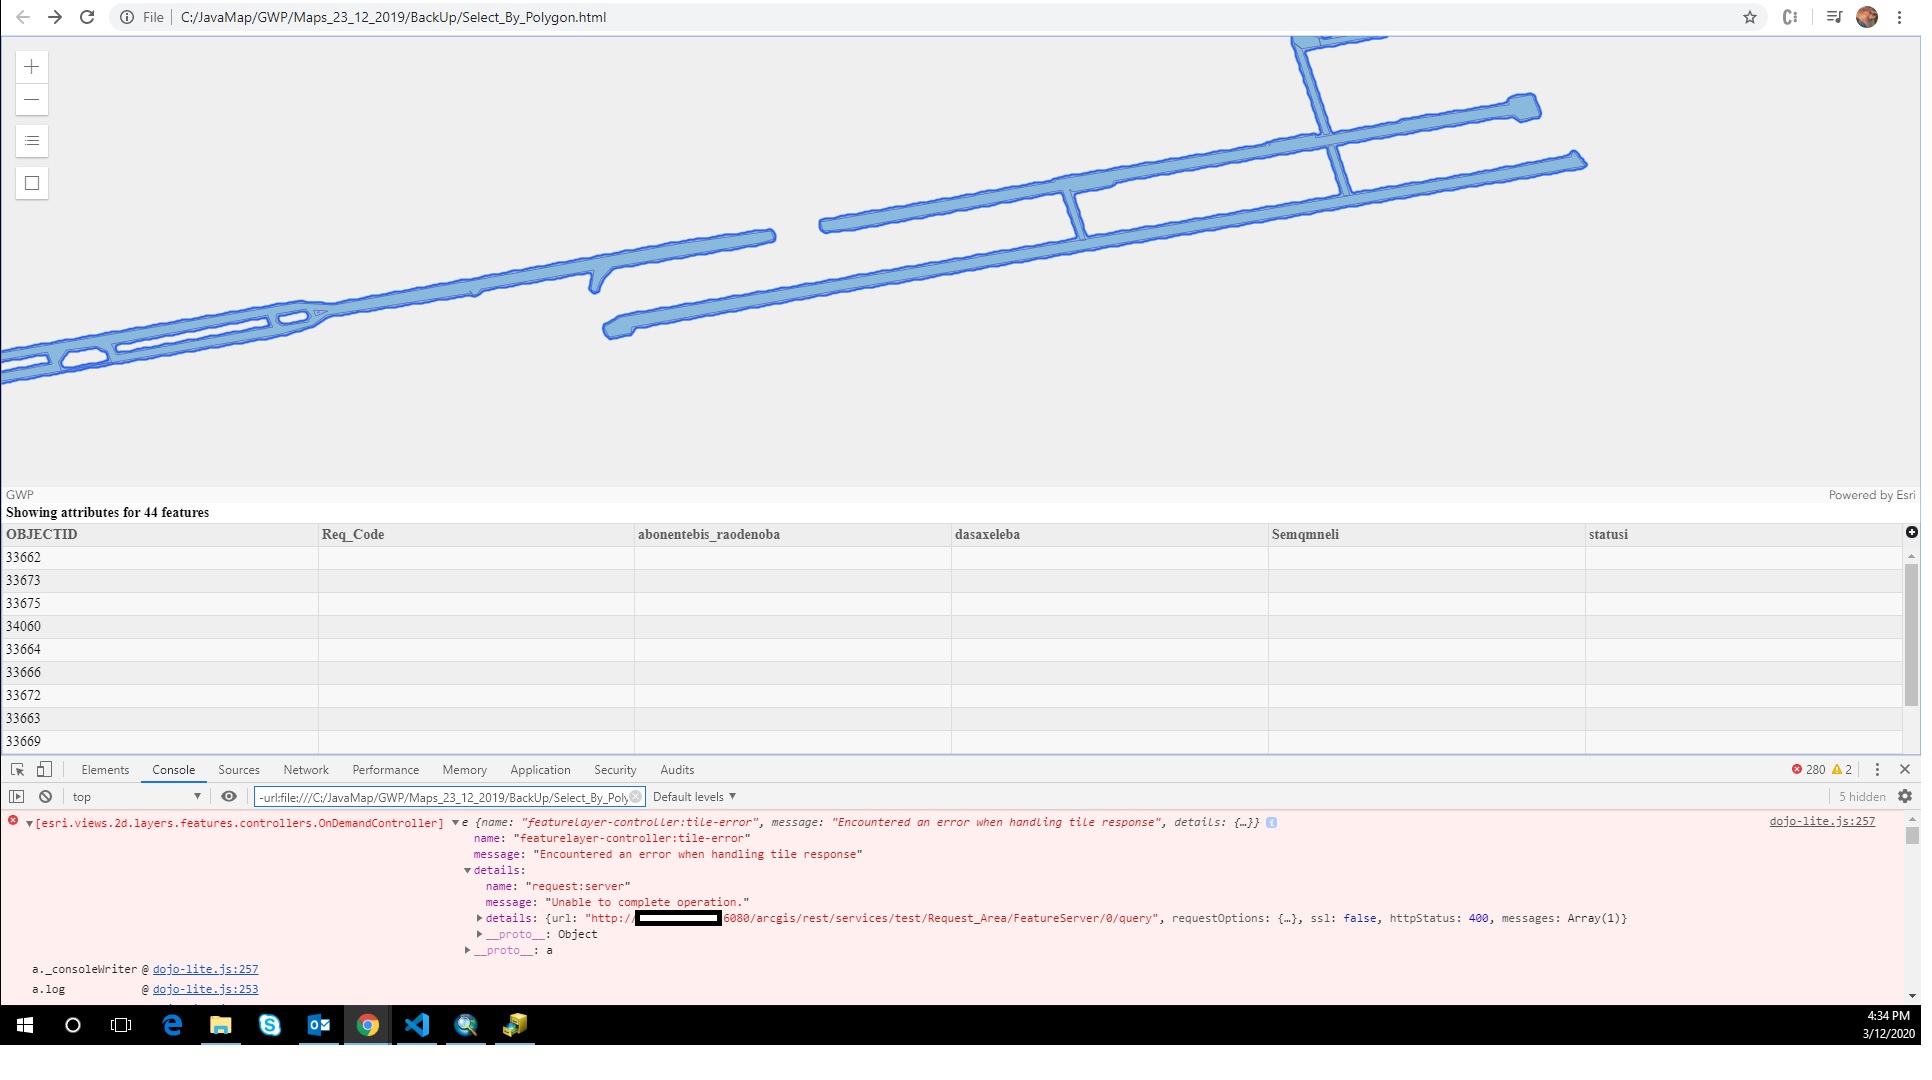
I am trying to select polygon features using sketchViewModel, using this sample code.
I removed CSV layer with FeatureLayer.
But now, when i select features, in table i see only OBJECTID, it applies column headers for other fields, but without data.
see Pic. for error and Code below.
Thank you in advance.
<!DOCTYPE html>
<html>
<head>
<meta charset="utf-8" />
<meta
name="viewport"
content="initial-scale=1,maximum-scale=1,user-scalable=no"
/>
<title>Highlight features by geometry - 4.14</title>
<link
rel="stylesheet"
href="https://js.arcgis.com/4.14/esri/themes/light/main.css"
/>
<script src="https://js.arcgis.com/4.14/"></script>
<style>
html,
body,
#viewDiv {
padding: 0;
margin: 0;
height: 100%;
width: 100%;
overflow: hidden;
}
#info,
#gridDisplay {
position: absolute;
bottom: 0;
left: 0;
height: 35%;
background-color: white;
border-color: grey;
width: 100%;
font-size: 14px;
}
#gridDisplay {
z-index: 80;
}
#info {
z-index: 90;
font-size: 16px;
padding-left: 20px;
}
#info * {
padding-right: 20px;
}
.info {
line-height: 20px;
padding-left: 5px !important;
}
.dgrid-header,
.dgrid-header-row {
background-color: #eee;
color: #57585a;
}
.dgrid-row-even {
background-color: #f7f8f8;
}
.dgrid-row-odd {
background-color: #efefef;
}
.dgrid-selected {
background: #b4daf5;
}
.dgrid-row {
border: none;
}
</style>
<script>
require([
"esri/WebMap",
"esri/views/MapView",
"esri/layers/FeatureLayer",
"esri/layers/GraphicsLayer",
"esri/widgets/Sketch/SketchViewModel",
"esri/Graphic",
"esri/widgets/Legend",
"esri/widgets/Expand",
"esri/widgets/FeatureForm",
"dgrid/OnDemandGrid",
"dgrid/extensions/ColumnHider",
"dojo/store/Memory",
"dstore/legacy/StoreAdapter",
"dgrid/Selection"
], function(
WebMap,
MapView,
FeatureLayer,
GraphicsLayer,
SketchViewModel,
Graphic,
Legend,
Expand,
FeatureForm,
OnDemandGrid,
ColumnHider,
Memory,
StoreAdapter,
Selection
) {
let map,
view,
flLayer,
csvLayerView,
polygonGraphicsLayer,
sketchViewModel,
highlight,
grid;
const gridDiv = document.getElementById("grid");
const infoDiv = document.getElementById("info");
// create new map, view and csvlayer
setupTheView();
// create a new sketchviewmodel, setup it properties
// set up the click event for the select by polygon button
setUpSketchViewModel();
sketchViewModel.on("create", function(event) {
if (event.state === "complete") {
// this polygon will be used to query features that intersect it
polygonGraphicsLayer.remove(event.graphic);
selectFeatures(event.graphic.geometry);
}
});
const gridFields = [
"OBJECTID",
"Req_Code",
"abonentebis_raodenoba",
"dasaxeleba",
"Semqmneli",
"statusi"
];
// create a new datastore for the on demandgrid
// will be used to display attributes of selected features
const dataStore = new StoreAdapter({
objectStore: new Memory({
idProperty: "OBJECTID"
})
});
// create a grid with given columns once the csvlayer is loaded
csvLayer
.when(function() {
// create a grid with columns specified in gridFields variable
createGrid(csvLayer.fields);
// get a reference the csvlayerview when it is ready. It will used to do
// client side queries when user draws polygon to select features
view.whenLayerView(csvLayer).then(function(layerView) {
csvLayerView = layerView;
});
})
.catch(errorCallback);
/****************************************************
* Selects features from the csv layer that intersect
* a polygon that user drew using sketch view model
****************************************************/
function selectFeatures(geometry) {
view.graphics.removeAll();
if (csvLayerView) {
// create a query and set its geometry parameter to the
// polygon that was drawn on the view
const query = {
geometry: geometry,
outFields: ["*"]
};
// query graphics from the csv layer view. Geometry set for the query
// can be polygon for point features and only intersecting geometries are returned
csvLayerView
.queryFeatures(query)
.then(function(results) {
const graphics = results.features;
// if the grid div is displayed while query results does not
// return graphics then hide the grid div and show the instructions div
if (graphics.length > 0) {
// zoom to the extent of the polygon with factor 2
view.goTo(geometry.extent.expand(2));
gridDiv.style.zIndex = 90;
infoDiv.style.zIndex = 80;
document.getElementById("featureCount").innerHTML =
"<b>Showing attributes for " +
graphics.length.toString() +
" features </b>";
} else {
gridDiv.style.zIndex = 80;
infoDiv.style.zIndex = 90;
}
// remove existing highlighted features
if (highlight) {
highlight.remove();
}
// highlight query results
highlight = csvLayerView.highlight(graphics);
// get the attributes to display in the grid
const data = graphics.map(function(feature, i) {
return (
Object.keys(feature.attributes)
.filter(function(key) {
// get fields that exist in the grid
return gridFields.indexOf(key) !== -1;
})
// need to create key value pairs from the feature
// attributes so that info can be displayed in the grid
.reduce(function(obj, key) {
obj[key] = feature.attributes[key];
return obj;
}, {})
);
});
// set the datastore for the grid using the
// attributes we got for the query results
dataStore.objectStore.data = data;
grid.set("collection", dataStore);
})
.catch(errorCallback);
}
}
/************************************************
* fires when user clicks a row in the grid
* get the corresponding graphic and select it
*************************************************/
function selectFeatureFromGrid(event) {
// close view popup if it is open
view.popup.close();
// get the ObjectID value from the clicked row
const row = event.rows[0];
const id = row.data.OBJECTID;
// setup a query by specifying objectIds
const query = {
objectIds: [parseInt(id)],
outFields: ["*"],
returnGeometry: true
};
// query the csvLayerView using the query set above
csvLayerView
.queryFeatures(query)
.then(function(results) {
const graphics = results.features;
// remove all graphics to make sure no selected graphics
view.graphics.removeAll();
// create a new selected graphic
const selectedGraphic = new Graphic({
geometry: graphics[0].geometry,
symbol: {
type: "simple-fill", // autocasts as new SimpleFillSymbol()
color: "yellow",
style: "solid",
outline: {
color: "red",
width: 1
}
}
});
// add the selected graphic to the view
// this graphic corresponds to the row that was clicked
view.graphics.add(selectedGraphic);
})
.catch(errorCallback);
}
/************************************************
* Creates a new grid. Loops through poverty
* csvLayer's fields and creates grid columns
* Grid with selection and columnhider extensions
*************************************************/
function createGrid(fields) {
var columns = fields
.filter(function(field, i) {
if (gridFields.indexOf(field.name) !== -1) {
return field;
}
})
.map(function(field) {
if (field.name === "__OBJECTID") {
return {
field: field.name,
label: field.name,
sortable: true,
hidden: true
};
} else {
return {
field: field.name,
label: field.alias,
sortable: true
};
}
});
// create a new onDemandGrid with its selection and columnhider
// extensions. Set the columns of the grid to display attributes
// the hurricanes cvslayer
grid = new (OnDemandGrid.createSubclass([Selection, ColumnHider]))(
{
columns: columns
},
"grid"
);
// add a row-click listener on the grid. This will be used
// to highlight the corresponding feature on the view
grid.on("dgrid-select", selectFeatureFromGrid);
}
/************************************************************************
* Sets up the sketchViewModel. When user clicks on the select by polygon
* button sketchViewModel.create() method is called with polygon param.
************************************************************************/
function setUpSketchViewModel() {
// polygonGraphicsLayer will be used by the sketchviewmodel
// show the polygon being drawn on the view
polygonGraphicsLayer = new GraphicsLayer();
map.add(polygonGraphicsLayer);
// add the select by polygon button the view
view.ui.add("select-by-polygon", "top-left");
const selectButton = document.getElementById("select-by-polygon");
// click event for the button
selectButton.addEventListener("click", function() {
clearUpSelection();
view.popup.close();
// ready to draw a polygon
sketchViewModel.create("polygon");
});
// create a new sketch view model set its layer
sketchViewModel = new SketchViewModel({
view: view,
layer: polygonGraphicsLayer,
pointSymbol: {
type: "simple-fill", // autocasts as new SimpleFillSymbol()
color: "yellow",
style: "solid",
outline: {
color: "red",
width: 1
}
}
});
}
function clearUpSelection() {
view.graphics.removeAll();
grid.clearSelection();
}
/******************************************************
* Sets up the view. WebMap with winkel III projection
* basemap and hurricanes CsvLayer is added to the view.
******************************************************/
function setupTheView() {
const url =
"http://1ocalhost:6080/arcgis/rest/services/test/Request_Area/FeatureServer/0";
csvLayer = new FeatureLayer({
title: "Hurricanes",
url: url,
copyright: "GWP",
});
map = new WebMap({
// contains a basemap with a Winkel III projection
// the CSVLayer coordinates will re-project client-side
portalItem: {
id: "7d127cef99a44327b79f5185602b8b6b"
},
layers: [csvLayer]
});
view = new MapView({
container: "viewDiv",
map: map,
highlightOptions: {
color: "#2B65EC",
fillOpacity: 0.4
},
padding: {
bottom: infoDiv.clientHeight // Same value as the #infoDiv height in CSS
}
});
const legendExpand = new Expand({
view: view,
content: new Legend({
view: view,
style: "card"
})
});
view.ui.add(legendExpand, "top-left");
view.popup.watch("visible", function(newValue) {
if (newValue) {
clearUpSelection();
}
});
}
function errorCallback(error) {
console.log("error:", error);
}
});
</script>
</head>
<body>
<div id="viewDiv">
<div
id="select-by-polygon"
class="esri-widget esri-widget--button esri-widget esri-interactive"
title="Select features by polygon"
>
<span class="esri-icon-checkbox-unchecked"></span>
</div>
<div id="info" class="esri-widget">
<span class="info"> <b>Instructions</b> </span> <br />
<ul>
<li>
Select features using select by polygon tool. Attributes of selected
features will be displayed here.
</li>
<br />
<li>
Click on a row to select a feature associated with it or click on a
feature to display its popup.
</li>
</ul>
</div>
<div id="gridDisplay">
<span class="info" id="featureCount"></span>
<div id="grid"></div>
</div>
</div>
</body>
</html>
Solved! Go to Solution.
1 Solution
Accepted Solutions
03-12-2020
05:47 AM
- Mark as New
- Bookmark
- Subscribe
- Mute
- Subscribe to RSS Feed
- Permalink
If you don't specify the outFields property when creating a FeatureLayer, it will only return ObjectID
csvLayer = new FeatureLayer({
title: "Hurricanes",
url: url,
copyright: "GWP",
outFields: ["*"]
});
2 Replies
03-12-2020
05:47 AM
- Mark as New
- Bookmark
- Subscribe
- Mute
- Subscribe to RSS Feed
- Permalink
If you don't specify the outFields property when creating a FeatureLayer, it will only return ObjectID
csvLayer = new FeatureLayer({
title: "Hurricanes",
url: url,
copyright: "GWP",
outFields: ["*"]
});
03-13-2020
05:23 AM
- Mark as New
- Bookmark
- Subscribe
- Mute
- Subscribe to RSS Feed
- Permalink
Oops, how i couldn't notify, thanks ken