- Home
- :
- All Communities
- :
- Developers
- :
- JavaScript Maps SDK
- :
- JavaScript Maps SDK Questions
- :
- Re: Popup and Layerlist
- Subscribe to RSS Feed
- Mark Topic as New
- Mark Topic as Read
- Float this Topic for Current User
- Bookmark
- Subscribe
- Mute
- Printer Friendly Page
- Mark as New
- Bookmark
- Subscribe
- Mute
- Subscribe to RSS Feed
- Permalink
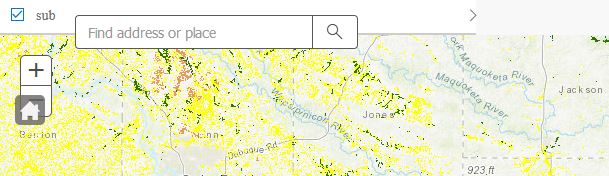
I want to combine the popup function (identify the pixel values or feature attributes for MapService) and layerlist widget, potentially add some other widgets. I follow the example for the ESRI's javascript API description but the widgets seem to be misplaced and the popup does not show in the current location. The content plane has been set to the right and the widgets to the left, but still not working. I would appreciate any inputs regarding this issue.
<!DOCTYPE html>
<html>
<head>
<meta http-equiv="Content-Type" content="text/html; charset=utf-8">
<!--The viewport meta tag is used to improve the presentation and behavior of the samples
on iOS devices-->
<meta name="viewport" content="initial-scale=1, maximum-scale=1,user-scalable=no">
<title>soil map</title>
<link rel="stylesheet" href="https://js.arcgis.com/3.29/esri/themes/calcite/esri/esri.css">
<link rel="stylesheet" href="https://js.arcgis.com/3.29/dijit/themes/claro/claro.css">
<style>
html, body, .container, #map {
height:100%;
width:100%;
margin:0;
padding:0;
margin:0;
font-family: "Open Sans";
}
#map {
padding:0;
}
#layerListPane{
width:25%;
}
.esriLayer{
background-color: #fff;
}
.esriLayerList .esriList{
border-top:none;
}
.esriLayerList .esriTitle {
background-color: #fff;
border-bottom:none;
}
.esriLayerList .esriList ul{
background-color: #fff;
}
#search {
display: block;
position: absolute;
z-index: 3;
top: 20px;
left: 75px;
}
#HomeButton {
position: absolute;
top: 100px;
left: 15px;
z-index: 50;
}
</style>
<script>var dojoConfig = { parseOnLoad: true };</script>
<script src="http://js.arcgis.com/3.29/"></script>
<script>
require([
"esri/dijit/Popup",
"esri/symbols/SimpleFillSymbol",
"esri/symbols/SimpleLineSymbol",
"esri/Color",
"dojo/dom-construct",
"esri/map",
"esri/dijit/HomeButton",
"esri/layers/ArcGISDynamicMapServiceLayer",
"esri/dijit/LayerList",
"esri/dijit/Search",
"esri/dijit/Legend",
"esri/dijit/Scalebar",
"esri/tasks/IdentifyTask",
"esri/tasks/IdentifyParameters",
"dojo/_base/array",
"esri/InfoTemplate",
"dojo/dom",
"dijit/layout/BorderContainer",
"dijit/layout/ContentPane",
"dojo/domReady!"
], function (
Popup, SimpleFillSymbol, SimpleLineSymbol, Color, domConstruct,
Map, HomeButton, ArcGISDynamicMapServiceLayer, LayerList, Search, Legend, Scalebar,
IdentifyTask, IdentifyParameters, arrayUtils, InfoTemplate,
dom
){
var map, identifyTask, identifyParams;
var popup = new Popup({
fillSymbol: new SimpleFillSymbol(SimpleFillSymbol.STYLE_SOLID,
new SimpleLineSymbol(SimpleLineSymbol.STYLE_SOLID,
new Color([255, 0, 0]), 2), new Color([255, 255, 0, 0.25]))
}, domConstruct.create("div"));
map = new Map("map", {
basemap: "topo",
center: [-90.125, 40],
zoom: 8,
infoWindow: popup
});
map.on("load", mapReady);
var rasterURL1 = "https://sampleserver6.arcgisonline.com/arcgis/rest/services/Census/MapServer";
var operationalLayer1 = new ArcGISDynamicMapServiceLayer(rasterURL1, { opacity: .80 });
map.addLayers([operationalLayer1]);
var layerList = new LayerList({
map: map,
layers: [{
layer: operationalLayer1,
id: "sub"
}],
showLegend: true,
showSubLayers: false,
showOpacitySlider: true
},"layerList");
layerList.startup();
var rasterURL2 = "https://sampleserver1.arcgisonline.com/ArcGIS/rest/services/Petroleum/KGS_OilGasFields_Kansas/MapServer";
map.addLayer(new ArcGISDynamicMapServiceLayer(rasterURL2,
{ opacity: .90 }));
var search = new Search({
map: map,
}, dom.byId("search"));
search.startup();
var home = new HomeButton({
map: map
}, "HomeButton");
home.startup();
var scalebar = new Scalebar({
map: map,
scalebarUnit: "dual"
});
scalebar.startup();
function mapReady () {
map.on("click", executeIdentifyTask);
//create identify tasks and setup parameters
identifyTask = new IdentifyTask(rasterURL1);
identifyParams = new IdentifyParameters();
identifyParams.tolerance = 1;
identifyParams.returnGeometry = true;
identifyParams.layerIds = [0,1];
identifyParams.layerOption = IdentifyParameters.LAYER_OPTION_ALL;
identifyParams.width = map.width;
identifyParams.height = map.height;
}
function executeIdentifyTask (event) {
identifyParams.geometry = event.mapPoint;
identifyParams.mapExtent = map.extent;
var deferred = identifyTask
.execute(identifyParams);
deferred.addCallback(function (response) {
return arrayUtils.map(response, function (result) {
var feature = result.feature;
var layerName = result.layerName;
//alert(result);
feature.attributes.layerName = layerName;
if (layerName === 'Census Block Points') {
var taxParcelTemplate = new InfoTemplate(layerName,
"the oject value is: " + feature.attributes['STATE_FIPS']);
feature.setInfoTemplate(taxParcelTemplate);
}
else if (layerName === 'KS_FIELD_OUTLINES_SPRING2005_GEONAD27') {
var taxParcelTemplate = new InfoTemplate(layerName,
"the oject value is: : " + feature.attributes['FIELD_NAME']);
feature.setInfoTemplate(taxParcelTemplate);
}
return feature;
});
});
map.infoWindow.setFeatures([deferred]);
map.infoWindow.show(event.mapPoint);
}
});
</script>
</head>
<body class="claro">
<div class="container" data-dojo-type="dijit/layout/BorderContainer" data-dojo-props="design:'headline', gutters:false">
<div id="layerListPane" data-dojo-type="dijit/layout/ContentPane" data-dojo-props="region:'right'">
<div id="layerList"></div>
</div>
<div id="map" data-dojo-type="dijit/layout/ContentPane" data-dojo-props="region:'center'"></div>
<div id="search" data-dojo-type="dijit/layout/ContentPane" data-dojo-props="region:'left'"></div>
<div id="legendDiv" data-dojo-type="dijit/layout/ContentPane" data-dojo-props="region:'left'"></div>
<div id="HomeButton" data-dojo-type="dijit/layout/ContentPane" data-dojo-props="region:'left'"></div>
</div>
</body>
</html>Solved! Go to Solution.
Accepted Solutions
- Mark as New
- Bookmark
- Subscribe
- Mute
- Subscribe to RSS Feed
- Permalink
Feng,
Here is your code corrected.
<!DOCTYPE html>
<html>
<head>
<meta http-equiv="Content-Type" content="text/html; charset=utf-8">
<!--The viewport meta tag is used to improve the presentation and behavior of the samples
on iOS devices-->
<meta name="viewport" content="initial-scale=1, maximum-scale=1,user-scalable=no">
<title>soil map</title>
<link rel="stylesheet" href="https://js.arcgis.com/3.29/dijit/themes/claro/claro.css">
<link rel="stylesheet" href="https://js.arcgis.com/3.29/esri/css/esri.css">
<style>
html,
body,
.container,
#map {
height: 100%;
width: 100%;
margin: 0;
padding: 0;
margin: 0;
font-family: "Open Sans";
}
#map {
padding: 0;
}
#layerListPane {
width: 25%;
}
.esriLayer {
background-color: #fff;
}
.esriLayerList .esriList {
border-top: none;
}
.esriLayerList .esriTitle {
background-color: #fff;
border-bottom: none;
}
.esriLayerList .esriList ul {
background-color: #fff;
}
#search {
display: block;
position: absolute;
z-index: 3;
top: 20px;
left: 75px;
}
#HomeButton {
position: absolute;
top: 100px;
left: 15px;
z-index: 50;
}
</style>
<script src="http://js.arcgis.com/3.29/"></script>
<script>
require([
"dojo/parser",
"esri/dijit/Popup",
"esri/symbols/SimpleFillSymbol",
"esri/symbols/SimpleLineSymbol",
"esri/Color",
"dojo/dom-construct",
"esri/map",
"esri/dijit/HomeButton",
"esri/layers/ArcGISDynamicMapServiceLayer",
"esri/dijit/LayerList",
"esri/dijit/Search",
"esri/dijit/Legend",
"esri/dijit/Scalebar",
"esri/tasks/IdentifyTask",
"esri/tasks/IdentifyParameters",
"dojo/_base/array",
"esri/InfoTemplate",
"dojo/dom",
"dijit/layout/BorderContainer",
"dijit/layout/ContentPane",
"dojo/domReady!"
], function (
parser, Popup, SimpleFillSymbol, SimpleLineSymbol, Color, domConstruct,
Map, HomeButton, ArcGISDynamicMapServiceLayer, LayerList, Search, Legend, Scalebar,
IdentifyTask, IdentifyParameters, arrayUtils, InfoTemplate,
dom
) {
parser.parse();
var map, identifyTask, identifyParams;
var popup = new Popup({
fillSymbol: new SimpleFillSymbol(SimpleFillSymbol.STYLE_SOLID,
new SimpleLineSymbol(SimpleLineSymbol.STYLE_SOLID,
new Color([255, 0, 0]), 2), new Color([255, 255, 0, 0.25]))
}, domConstruct.create("div"));
map = new Map("map", {
basemap: "topo",
center: [-90.125, 40],
zoom: 8,
infoWindow: popup
});
map.on("load", mapReady);
var rasterURL1 = "https://sampleserver6.arcgisonline.com/arcgis/rest/services/Census/MapServer";
var operationalLayer1 = new ArcGISDynamicMapServiceLayer(rasterURL1, {
opacity: .80
});
map.addLayers([operationalLayer1]);
var layerList = new LayerList({
map: map,
layers: [{
layer: operationalLayer1,
id: "sub"
}],
showLegend: true,
showSubLayers: false,
showOpacitySlider: true
}, "layerList");
layerList.startup();
var rasterURL2 =
"https://sampleserver1.arcgisonline.com/ArcGIS/rest/services/Petroleum/KGS_OilGasFields_Kansas/MapServer";
map.addLayer(new ArcGISDynamicMapServiceLayer(rasterURL2, {
opacity: .90
}));
var search = new Search({
map: map,
}, dom.byId("search"));
search.startup();
var home = new HomeButton({
map: map
}, "HomeButton");
home.startup();
var scalebar = new Scalebar({
map: map,
scalebarUnit: "dual"
});
function mapReady() {
map.on("click", executeIdentifyTask);
//create identify tasks and setup parameters
identifyTask = new IdentifyTask(rasterURL1);
identifyParams = new IdentifyParameters();
identifyParams.tolerance = 1;
identifyParams.returnGeometry = true;
identifyParams.layerIds = [0, 1];
identifyParams.layerOption = IdentifyParameters.LAYER_OPTION_ALL;
identifyParams.width = map.width;
identifyParams.height = map.height;
}
function executeIdentifyTask(event) {
identifyParams.geometry = event.mapPoint;
identifyParams.mapExtent = map.extent;
var deferred = identifyTask
.execute(identifyParams);
deferred.addCallback(function (response) {
return arrayUtils.map(response, function (result) {
var feature = result.feature;
var layerName = result.layerName;
//alert(result);
feature.attributes.layerName = layerName;
if (layerName === 'Census Block Points') {
var taxParcelTemplate = new InfoTemplate(layerName,
"the oject value is: " + feature.attributes['STATE_FIPS']);
feature.setInfoTemplate(taxParcelTemplate);
} else if (layerName === 'KS_FIELD_OUTLINES_SPRING2005_GEONAD27') {
var taxParcelTemplate = new InfoTemplate(layerName,
"the oject value is: : " + feature.attributes['FIELD_NAME']);
feature.setInfoTemplate(taxParcelTemplate);
}
return feature;
});
});
map.infoWindow.setFeatures([deferred]);
map.infoWindow.show(event.mapPoint);
}
});
</script>
</head>
<body class="claro">
<div class="container" data-dojo-type="dijit/layout/BorderContainer" data-dojo-props="design:'headline', gutters:false" style="width:100%; height:100%;">
<div id="layerListPane" data-dojo-type="dijit.layout.ContentPane" data-dojo-props="region:'right'">
<div id="layerList"></div>
</div>
<div id="map" data-dojo-type="dijit/layout/ContentPane" data-dojo-props="region:'center'">
<div id="search"></div>
<div id="HomeButton"></div>
</div>
<!-- <div id="legendDiv" data-dojo-type="dijit/layout/ContentPane" data-dojo-props="region:'left'"></div> -->
</div>
</body>
</html>- Mark as New
- Bookmark
- Subscribe
- Mute
- Subscribe to RSS Feed
- Permalink
Feng,
You are missing a css file:
<link rel="stylesheet" href="https://js.arcgis.com/3.29/esri/css/esri.css">
Once you add this css file link things will draw better, but you still have a lot of work to do with placement.
- Mark as New
- Bookmark
- Subscribe
- Mute
- Subscribe to RSS Feed
- Permalink
Robert,
Thank you for your response. I added this missing css file and it does look better. However, all of the widgets and the layerlist are stacked together on the left. Could you collaborate a bit more about the placement since I have already set the panel to the right?
- Mark as New
- Bookmark
- Subscribe
- Mute
- Subscribe to RSS Feed
- Permalink
Feng,
Here is your code corrected.
<!DOCTYPE html>
<html>
<head>
<meta http-equiv="Content-Type" content="text/html; charset=utf-8">
<!--The viewport meta tag is used to improve the presentation and behavior of the samples
on iOS devices-->
<meta name="viewport" content="initial-scale=1, maximum-scale=1,user-scalable=no">
<title>soil map</title>
<link rel="stylesheet" href="https://js.arcgis.com/3.29/dijit/themes/claro/claro.css">
<link rel="stylesheet" href="https://js.arcgis.com/3.29/esri/css/esri.css">
<style>
html,
body,
.container,
#map {
height: 100%;
width: 100%;
margin: 0;
padding: 0;
margin: 0;
font-family: "Open Sans";
}
#map {
padding: 0;
}
#layerListPane {
width: 25%;
}
.esriLayer {
background-color: #fff;
}
.esriLayerList .esriList {
border-top: none;
}
.esriLayerList .esriTitle {
background-color: #fff;
border-bottom: none;
}
.esriLayerList .esriList ul {
background-color: #fff;
}
#search {
display: block;
position: absolute;
z-index: 3;
top: 20px;
left: 75px;
}
#HomeButton {
position: absolute;
top: 100px;
left: 15px;
z-index: 50;
}
</style>
<script src="http://js.arcgis.com/3.29/"></script>
<script>
require([
"dojo/parser",
"esri/dijit/Popup",
"esri/symbols/SimpleFillSymbol",
"esri/symbols/SimpleLineSymbol",
"esri/Color",
"dojo/dom-construct",
"esri/map",
"esri/dijit/HomeButton",
"esri/layers/ArcGISDynamicMapServiceLayer",
"esri/dijit/LayerList",
"esri/dijit/Search",
"esri/dijit/Legend",
"esri/dijit/Scalebar",
"esri/tasks/IdentifyTask",
"esri/tasks/IdentifyParameters",
"dojo/_base/array",
"esri/InfoTemplate",
"dojo/dom",
"dijit/layout/BorderContainer",
"dijit/layout/ContentPane",
"dojo/domReady!"
], function (
parser, Popup, SimpleFillSymbol, SimpleLineSymbol, Color, domConstruct,
Map, HomeButton, ArcGISDynamicMapServiceLayer, LayerList, Search, Legend, Scalebar,
IdentifyTask, IdentifyParameters, arrayUtils, InfoTemplate,
dom
) {
parser.parse();
var map, identifyTask, identifyParams;
var popup = new Popup({
fillSymbol: new SimpleFillSymbol(SimpleFillSymbol.STYLE_SOLID,
new SimpleLineSymbol(SimpleLineSymbol.STYLE_SOLID,
new Color([255, 0, 0]), 2), new Color([255, 255, 0, 0.25]))
}, domConstruct.create("div"));
map = new Map("map", {
basemap: "topo",
center: [-90.125, 40],
zoom: 8,
infoWindow: popup
});
map.on("load", mapReady);
var rasterURL1 = "https://sampleserver6.arcgisonline.com/arcgis/rest/services/Census/MapServer";
var operationalLayer1 = new ArcGISDynamicMapServiceLayer(rasterURL1, {
opacity: .80
});
map.addLayers([operationalLayer1]);
var layerList = new LayerList({
map: map,
layers: [{
layer: operationalLayer1,
id: "sub"
}],
showLegend: true,
showSubLayers: false,
showOpacitySlider: true
}, "layerList");
layerList.startup();
var rasterURL2 =
"https://sampleserver1.arcgisonline.com/ArcGIS/rest/services/Petroleum/KGS_OilGasFields_Kansas/MapServer";
map.addLayer(new ArcGISDynamicMapServiceLayer(rasterURL2, {
opacity: .90
}));
var search = new Search({
map: map,
}, dom.byId("search"));
search.startup();
var home = new HomeButton({
map: map
}, "HomeButton");
home.startup();
var scalebar = new Scalebar({
map: map,
scalebarUnit: "dual"
});
function mapReady() {
map.on("click", executeIdentifyTask);
//create identify tasks and setup parameters
identifyTask = new IdentifyTask(rasterURL1);
identifyParams = new IdentifyParameters();
identifyParams.tolerance = 1;
identifyParams.returnGeometry = true;
identifyParams.layerIds = [0, 1];
identifyParams.layerOption = IdentifyParameters.LAYER_OPTION_ALL;
identifyParams.width = map.width;
identifyParams.height = map.height;
}
function executeIdentifyTask(event) {
identifyParams.geometry = event.mapPoint;
identifyParams.mapExtent = map.extent;
var deferred = identifyTask
.execute(identifyParams);
deferred.addCallback(function (response) {
return arrayUtils.map(response, function (result) {
var feature = result.feature;
var layerName = result.layerName;
//alert(result);
feature.attributes.layerName = layerName;
if (layerName === 'Census Block Points') {
var taxParcelTemplate = new InfoTemplate(layerName,
"the oject value is: " + feature.attributes['STATE_FIPS']);
feature.setInfoTemplate(taxParcelTemplate);
} else if (layerName === 'KS_FIELD_OUTLINES_SPRING2005_GEONAD27') {
var taxParcelTemplate = new InfoTemplate(layerName,
"the oject value is: : " + feature.attributes['FIELD_NAME']);
feature.setInfoTemplate(taxParcelTemplate);
}
return feature;
});
});
map.infoWindow.setFeatures([deferred]);
map.infoWindow.show(event.mapPoint);
}
});
</script>
</head>
<body class="claro">
<div class="container" data-dojo-type="dijit/layout/BorderContainer" data-dojo-props="design:'headline', gutters:false" style="width:100%; height:100%;">
<div id="layerListPane" data-dojo-type="dijit.layout.ContentPane" data-dojo-props="region:'right'">
<div id="layerList"></div>
</div>
<div id="map" data-dojo-type="dijit/layout/ContentPane" data-dojo-props="region:'center'">
<div id="search"></div>
<div id="HomeButton"></div>
</div>
<!-- <div id="legendDiv" data-dojo-type="dijit/layout/ContentPane" data-dojo-props="region:'left'"></div> -->
</div>
</body>
</html>- Mark as New
- Bookmark
- Subscribe
- Mute
- Subscribe to RSS Feed
- Permalink
Thank you very much Robert.
I would like to know if you have any comment on the identifyTask? I want to show the values for each layer that is toggled on in the layerlist panel.
identifyTask = new IdentifyTask(rasterURL1);
- Mark as New
- Bookmark
- Subscribe
- Mute
- Subscribe to RSS Feed
- Permalink
Feng,
My recommendation is not to use IdentifyTask and instead just use standard infoTemplates:
<!DOCTYPE html>
<html>
<head>
<meta http-equiv="Content-Type" content="text/html; charset=utf-8">
<!--The viewport meta tag is used to improve the presentation and behavior of the samples
on iOS devices-->
<meta name="viewport" content="initial-scale=1, maximum-scale=1,user-scalable=no">
<title>soil map</title>
<link rel="stylesheet" href="https://js.arcgis.com/3.29/dijit/themes/claro/claro.css">
<link rel="stylesheet" href="https://js.arcgis.com/3.29/esri/css/esri.css">
<style>
html,
body,
.container,
#map {
height: 100%;
width: 100%;
margin: 0;
padding: 0;
margin: 0;
font-family: "Open Sans";
}
#map {
padding: 0;
}
#layerListPane {
width: 25%;
}
.esriLayer {
background-color: #fff;
}
.esriLayerList .esriList {
border-top: none;
}
.esriLayerList .esriTitle {
background-color: #fff;
border-bottom: none;
}
.esriLayerList .esriList ul {
background-color: #fff;
}
#search {
display: block;
position: absolute;
z-index: 3;
top: 20px;
left: 75px;
}
#HomeButton {
position: absolute;
top: 100px;
left: 15px;
z-index: 50;
}
</style>
<script src="http://js.arcgis.com/3.29/"></script>
<script>
require([
"dojo/parser",
"esri/dijit/Popup",
"esri/symbols/SimpleFillSymbol",
"esri/symbols/SimpleLineSymbol",
"esri/Color",
"dojo/dom-construct",
"esri/map",
"esri/dijit/HomeButton",
"esri/layers/ArcGISDynamicMapServiceLayer",
"esri/dijit/LayerList",
"esri/dijit/Search",
"esri/dijit/Legend",
"esri/dijit/Scalebar",
"esri/tasks/IdentifyTask",
"esri/tasks/IdentifyParameters",
"dojo/_base/array",
"esri/InfoTemplate",
"dojo/dom",
"dijit/layout/BorderContainer",
"dijit/layout/ContentPane",
"dojo/domReady!"
], function (
parser, Popup, SimpleFillSymbol, SimpleLineSymbol, Color, domConstruct,
Map, HomeButton, ArcGISDynamicMapServiceLayer, LayerList, Search, Legend, Scalebar,
IdentifyTask, IdentifyParameters, arrayUtils, InfoTemplate,
dom
) {
parser.parse();
var map, identifyTask, identifyParams;
var popup = new Popup({
fillSymbol: new SimpleFillSymbol(SimpleFillSymbol.STYLE_SOLID,
new SimpleLineSymbol(SimpleLineSymbol.STYLE_SOLID,
new Color([255, 0, 0]), 2), new Color([255, 255, 0, 0.25]))
}, domConstruct.create("div"));
map = new Map("map", {
basemap: "topo",
center: [-90.125, 40],
zoom: 8,
infoWindow: popup
});
var rasterURL1 = "https://sampleserver6.arcgisonline.com/arcgis/rest/services/Census/MapServer";
var operationalLayer1 = new ArcGISDynamicMapServiceLayer(rasterURL1, {
opacity: .80,
infoTemplates: {
0: {
infoTemplate: new InfoTemplate('Census Block Points', "the object value is: ${STATE_FIPS}")
},
1: {
infoTemplate: new InfoTemplate('Census Block Group', "the object value is: ${STATE_FIPS}")
}
}
});
map.addLayers([operationalLayer1]);
var layerList = new LayerList({
map: map,
layers: [{
layer: operationalLayer1,
id: "sub"
}],
showLegend: true,
showSubLayers: false,
showOpacitySlider: true
}, "layerList");
layerList.startup();
var rasterURL2 =
"https://sampleserver1.arcgisonline.com/ArcGIS/rest/services/Petroleum/KGS_OilGasFields_Kansas/MapServer";
map.addLayer(new ArcGISDynamicMapServiceLayer(rasterURL2, {
opacity: .90,
infoTemplates: {
0: {
infoTemplate: new InfoTemplate('KS Field', "the object value is: ${FIELD_NAME}")
}
}
}));
var search = new Search({
map: map,
}, dom.byId("search"));
search.startup();
var home = new HomeButton({
map: map
}, "HomeButton");
home.startup();
var scalebar = new Scalebar({
map: map,
scalebarUnit: "dual"
});
});
</script>
</head>
<body class="claro">
<div class="container" data-dojo-type="dijit/layout/BorderContainer" data-dojo-props="design:'headline', gutters:false" style="width:100%; height:100%;">
<div id="layerListPane" data-dojo-type="dijit.layout.ContentPane" data-dojo-props="region:'right'">
<div id="layerList"></div>
</div>
<div id="map" data-dojo-type="dijit/layout/ContentPane" data-dojo-props="region:'center'">
<div id="search"></div>
<div id="HomeButton"></div>
</div>
<!-- <div id="legendDiv" data-dojo-type="dijit/layout/ContentPane" data-dojo-props="region:'left'"></div> -->
</div>
</body>
</html>- Mark as New
- Bookmark
- Subscribe
- Mute
- Subscribe to RSS Feed
- Permalink
Thanks Robert. So how to use this for raster layers (pixel values)? Some of my raster layers have attribute table but some do not (float type).
- Mark as New
- Bookmark
- Subscribe
- Mute
- Subscribe to RSS Feed
- Permalink
Feng,
OK, rasters will require the use of IdentifyTask. The identifyTask is based on a particular url though. so if each of your layers have a different url then you will have to run a IdentifyTask on each url and get the results before you show the popup. Dojo has a class called "dojo/promise/all" that is just for this use case (i.e. multiple async tasks and waiting for them all to return before proceeding to some code block).
- Mark as New
- Bookmark
- Subscribe
- Mute
- Subscribe to RSS Feed
- Permalink
Robert,
Thanks. Would it be possible to provide an example for this? How do I return the currently toggled layers and show specific popups for them?