- Home
- :
- All Communities
- :
- Developers
- :
- JavaScript Maps SDK
- :
- JavaScript Maps SDK Questions
- :
- Plotting client data points on a UK WMTS tile laye...
- Subscribe to RSS Feed
- Mark Topic as New
- Mark Topic as Read
- Float this Topic for Current User
- Bookmark
- Subscribe
- Mute
- Printer Friendly Page
Plotting client data points on a UK WMTS tile layer
- Mark as New
- Bookmark
- Subscribe
- Mute
- Subscribe to RSS Feed
- Permalink
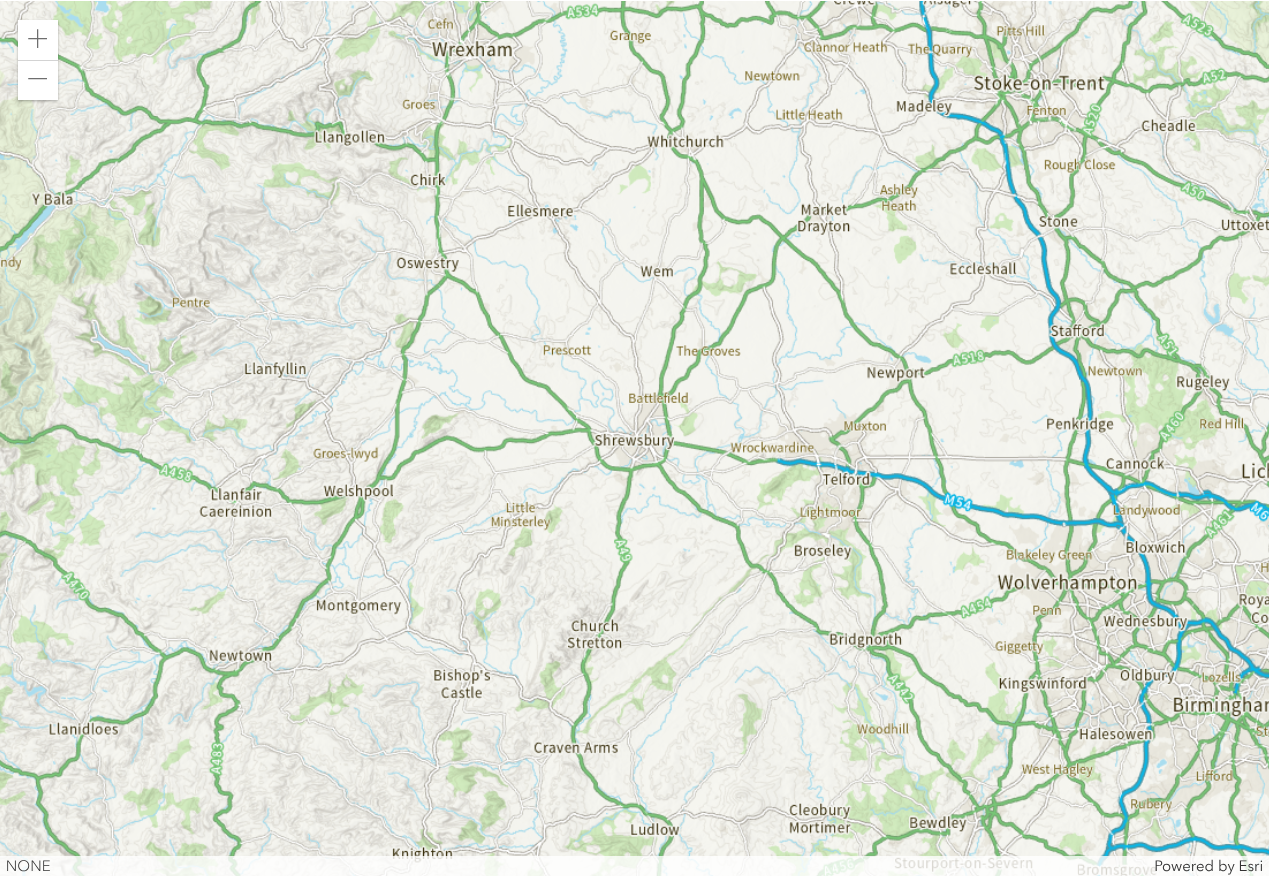
I want to use a UK map as a basemap, overlay it with the UK county boundaries and plot client data points. As a simple example I will be showing a map of Shropshire (for example) with a number of sites (typically nature reserves) shown as points on the map. The client data for the location of these sites will be held in a MySQL database.
I have so far been able to construct the map using a WTMS layer from the Ordnance Survey Data Hub. The code for this and the screenshot of the result is shown below (minus my API key).
I know that I cannot plot points directly on to a WTMS layer but instead need to use another layer (Graphics?, Feature?) but I am struggling to work out how to do this. I do realise that I need to use the same spatial reference (27700) but I am not experienced enough to know how to begin. Any help would be really appreciated.
Here is my script