- Home
- :
- All Communities
- :
- Developers
- :
- JavaScript Maps SDK
- :
- JavaScript Maps SDK Questions
- :
- Re: Javascript ElevationProfile widget XAxis
- Subscribe to RSS Feed
- Mark Topic as New
- Mark Topic as Read
- Float this Topic for Current User
- Bookmark
- Subscribe
- Mute
- Printer Friendly Page
Javascript ElevationProfile widget XAxis
- Mark as New
- Bookmark
- Subscribe
- Mute
- Subscribe to RSS Feed
- Permalink
I am using the Javascript Elevation Profile widget for the WebAppbuilder
and have updated the 'this.elevationData' values to start at a number greater than 0.
i.e my collection of measurements would have values like 500,600,700 instead of 0,100,200.
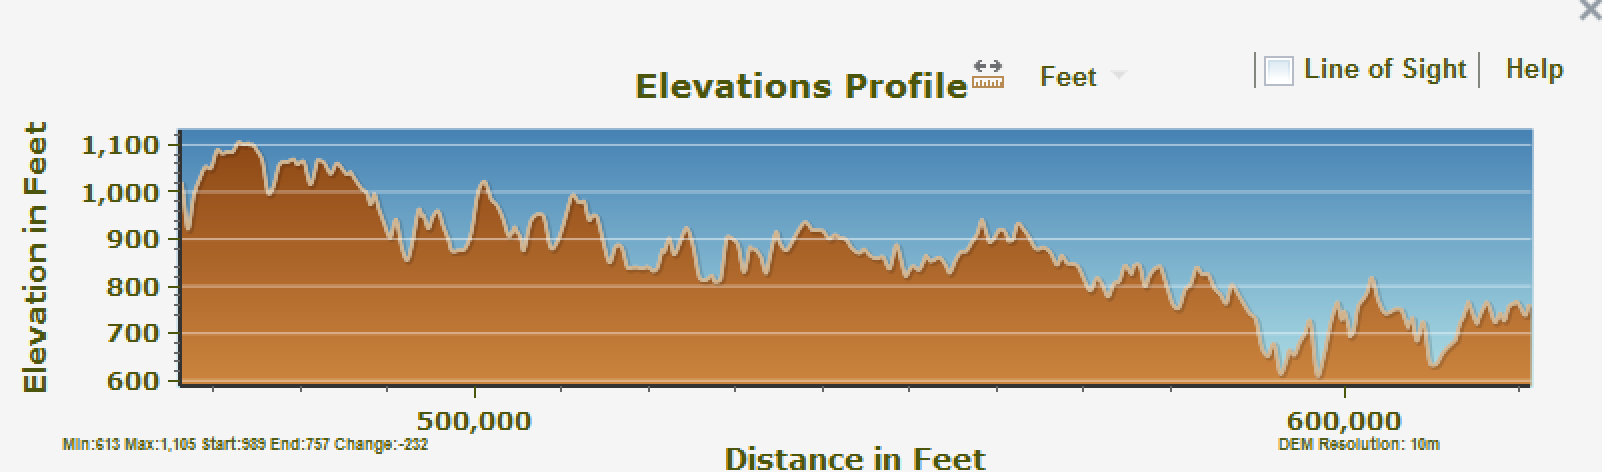
The Chart displays my elevation data at correct measurements but still includes the 0-500 part of the chart(and labels) that has no data.
So my question is how does one control the Xaxis labels and make the chart 'fit' my data, not assume I am starting at 0?
If you see the attachment the data that is showing is exactly what I want, I just want the labels and the data to start at around the 460,000 mark. Removing 0-460,000 from chart and x-axis completely...
Thanks..just looking for a nudge in right direction.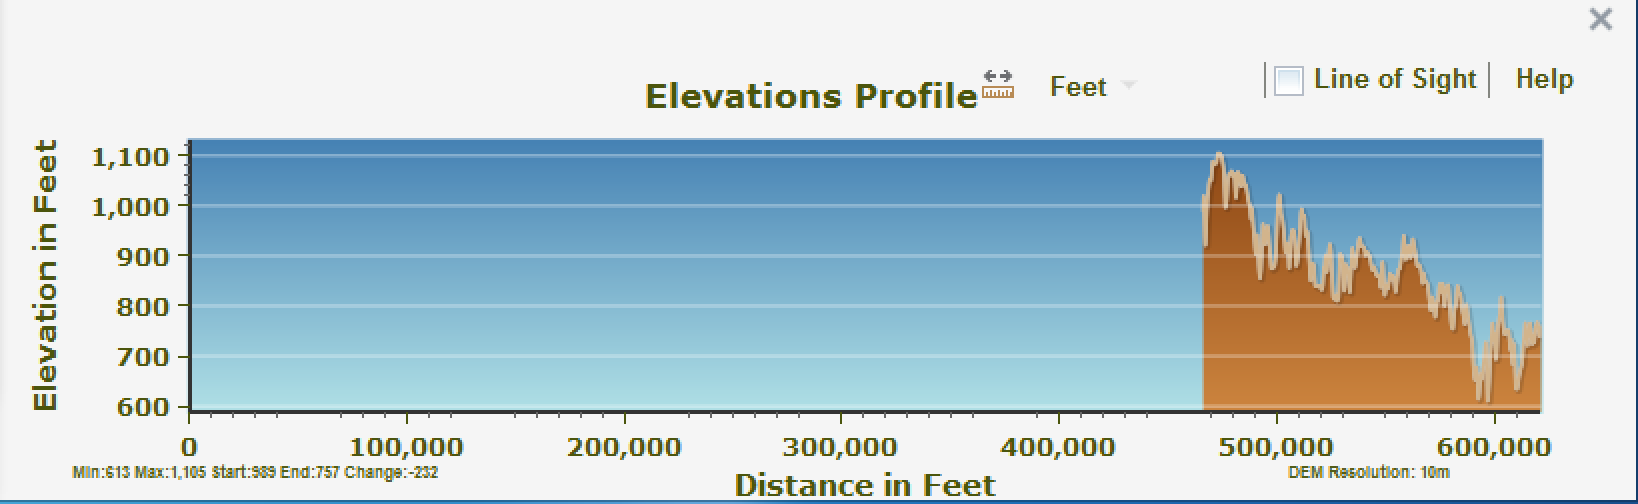
- Mark as New
- Bookmark
- Subscribe
- Mute
- Subscribe to RSS Feed
- Permalink
I figured out the issue was with the adding of the losmarkers series.
I removed the line that added that series and it now works as desired. see attachment