- Home
- :
- All Communities
- :
- Developers
- :
- JavaScript Maps SDK
- :
- JavaScript Maps SDK Questions
- :
- InfoWindow fields - URLs automatically add "_blank...
- Subscribe to RSS Feed
- Mark Topic as New
- Mark Topic as Read
- Float this Topic for Current User
- Bookmark
- Subscribe
- Mute
- Printer Friendly Page
InfoWindow fields - URLs automatically add "_blank" as target
- Mark as New
- Bookmark
- Subscribe
- Mute
- Subscribe to RSS Feed
- Permalink
I have an application creating layers from an asynch JSON request - in the data pull, I have a field that contains a URL embedded within an anchor tag html element.
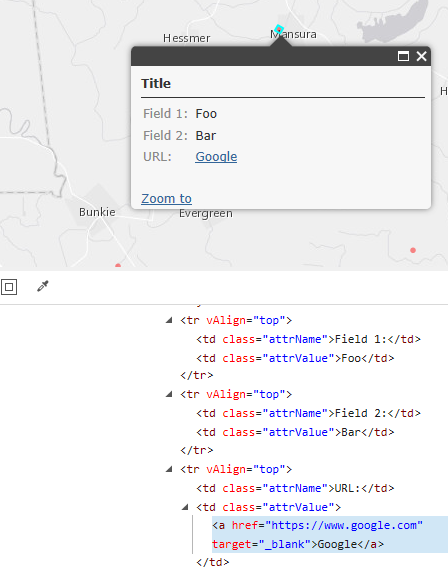
I am creating a featureLayer object from a featureCollection, which contains a layerDefinition where the URL field is defined. Everything works well - the layer loads with the proper symbology and all of my fields exist within the layer object; however, when the InfoWindow opens, the link automatically assigns "_blank" as the target:
Even If I explicitly set the target in the html element, e.g.:
<a href="http://www.google.com" target="_parent">Google</a>
We still end-up with "_blank" as the target.
I tried using a javascript function, e.g. href=javascript:window.open('www.google.com', '_parent');
But, the target is prepended. Is there something within the InfoWindow class that automagically adds the target attribute? Nothing jumped out while I perused the API class page:
InfoWindow | API Reference | ArcGIS API for JavaScript
Thanks for the help.
Solved! Go to Solution.
Accepted Solutions
- Mark as New
- Bookmark
- Subscribe
- Mute
- Subscribe to RSS Feed
- Permalink
Chris,
This sample demonstrates a popup hyperlink that send the apps current page to the hyperlinks url. I could have shortened up the code a bit but I choose to use an existing API sample.
<!DOCTYPE html>
<html>
  <head>
    <meta http-equiv="Content-Type" content="text/html; charset=utf-8">
    <!--The viewport meta tag is used to improve the presentation and behavior of the samples
      on iOS devices-->
    <meta name="viewport" content="initial-scale=1, maximum-scale=1,user-scalable=no">
    <title>Formatter Function</title>

    <link rel="stylesheet" href="http://js.arcgis.com/3.13/dijit/themes/soria/soria.css">
    <link rel="stylesheet" href="http://js.arcgis.com/3.13/dojox/layout/resources/ExpandoPane.css">
    <link rel="stylesheet" href="http://js.arcgis.com/3.13/esri/css/esri.css">
    <style>
      html, body { height: 100%; width: 100%; margin: 0; padding: 0; }
    </style>

    <script src="http://js.arcgis.com/3.13/"></script>
    <script>
      // infotemplate formatting functions need to be in the global scope to work
      var map, compare, compare2;

      require([
        "esri/map",
        "esri/InfoTemplate",
        "esri/layers/FeatureLayer",
        "esri/renderers/SimpleRenderer",
        "esri/symbols/SimpleFillSymbol",
        "esri/symbols/SimpleLineSymbol",
        "dojo/dom",
        "dojo/number",
        "dojo/on",
        "dojo/parser",
        "esri/Color",
        "dijit/layout/BorderContainer",
        "dijit/layout/ContentPane",
        "dojox/layout/ExpandoPane",
        "dojo/domReady!"
      ],
        function (
          Map, InfoTemplate, FeatureLayer, SimpleRenderer, SimpleFillSymbol,
          SimpleLineSymbol, dom, number, on, parser, Color
      ) {

          parser.parse();

          map = new Map("mapDiv", {
            basemap: "streets",
            center: [-86.796, 47.13],
            zoom: 7
          });

          var infoTemplate = new InfoTemplate();
          infoTemplate.setTitle("Population in ${NAME}");
          infoTemplate.setContent("<b>2007 :D: </b>${POP2007:compare}<br/>" +
                                  "<b>2007 density: </b>${POP07_SQMI:compare}<br/><br/>" +
                                  "<b>2000: </b>${POP2000:NumberFormat}<br/>" +
                                  "<b>2000 density: </b>${POP00_SQMI:NumberFormat}<br/><br/>" +
                                  "<a target='_self' href=http://en.wikipedia.org/wiki/Olea_europaea>Wikipedia Entry</a>");

          var counties = new FeatureLayer("http://sampleserver1.arcgisonline.com/ArcGIS/rest/services/Demographics/ESRI_Census_USA/MapServer/3", {
            mode: FeatureLayer.MODE_SNAPSHOT,
            infoTemplate: infoTemplate,
            outFields: [
              "NAME", "POP2000", "POP2007", "POP00_SQMI",
              "POP07_SQMI"
            ]
          });

          counties.setDefinitionExpression("STATE_NAME = 'Michigan'");

          //apply a renderer
          var symbol = new SimpleFillSymbol(SimpleFillSymbol.STYLE_SOLID,
            new SimpleLineSymbol(SimpleLineSymbol.STYLE_SOLID,
              new Color([255, 255, 255, 0.35]), 1),
            new Color([109, 146, 155, 0.35]));
          counties.setRenderer(new SimpleRenderer(symbol));

          map.addLayer(counties);

          on(dom.byId("chkT1"), "click", changeInfoTemplate);
          on(dom.byId("chkT2"), "click", changeInfoTemplate);

          dom.byId("chkT1").checked = true;

          compare = function (value, key, data) {
            var result = "", diff, pctChange;

            switch (key) {
              case "POP2007":
                result = value > data.POP2000 ? "images/up.png" : "images/down.png";
                diff = data.POP2007 - data.POP2000;
                pctChange = (diff * 100) / data.POP2000;
                break;

              case "POP07_SQMI":
                result = value > data.POP00_SQMI ? "images/up.png" : "images/down.png";
                diff = data.POP07_SQMI - data.POP00_SQMI;
                pctChange = (diff * 100) / data.POP00_SQMI;
                break;
            }

            return number.format(value) +
                   "   <img src='" + result + "'/>" +
                   "  <span style='color: " +
                   (pctChange < 0 ? "red" : "green") + ";'>"
                     + number.format(pctChange, { places: 3 }) +
                   "%</span>";
          };

          compare2 = function (value, key, data) {
            var diff = data.POP2007 - data.POP2000;
            var result = diff > 0 ? "images/up.png" : "images/down.png";
            var pctChange = (diff * 100) / data.POP2000;

            return "<img src='" + result + "'/>" +
                   "  <span style='color: " +
                   (pctChange < 0 ? "red" : "green") + ";'>"
                     + number.format(pctChange, { places: 3 }) +
                   "%</span>";
          };

          function changeInfoTemplate () {
            console.log("changed");
            map.infoWindow.hide();

            var t1Checked = dom.byId("chkT1").checked;
            var t2Checked = dom.byId("chkT2").checked;
            var templateContent = "";

            if (t1Checked) {
              templateContent = "<b>2007: </b>${POP2007:compare}<br/>" +
                                "<b>2007 density: </b>${POP07_SQMI:compare}<br/><br/>" +
                                "<b>2000: </b>${POP2000:NumberFormat}<br/>" +
                                "<b>2000 density: </b>${POP00_SQMI:NumberFormat}<br/>" +
                                "<a target='_self' href=http://en.wikipedia.org/wiki/Olea_europaea>Wikipedia Entry</a>";
            }
            else if (t2Checked) {
              templateContent = "<b>2007: </b>${POP2007}<br/>" +
                                "<b>2007 density: </b>${POP07_SQMI}<br/><br/>" +
                                "<b>2000: </b>${POP2000:NumberFormat}<br/>" +
                                "<b>2000 density: </b>${POP00_SQMI:NumberFormat}<br/><br/>" +
                                "Diff: ${DIFF:compare2}<br/>" +
                                "<a target='_self' href=http://en.wikipedia.org/wiki/Olea_europaea>Wikipedia Entry</a>";
            }

            counties.infoTemplate.setContent(templateContent);
          }
        });
    </script>
  </head>
  <body class="soria">
    <div data-dojo-type="dijit/layout/BorderContainer"
         data-dojo-props="design:'headline', gutters:true"
         style="width: 100%; height: 100%; margin: 0;">

      <div data-dojo-type="dojox/layout/ExpandoPane"
           data-dojo-props="duration:300, title:'Details', region:'left', maxWidth:'220px', easeIn:'easing.linear', easeOut:'easing.linear'"
           style="width:220px;">
         <p>
          Click a county to view the population change between 2000 and 2007.<br/> <br/>
          <b>Change the info template:</b> Template 1 displays the percentage growth (or decline) in population. The values are color-coded green for population increase and red for decline in population. Template 2 creates a new calculated field called diff that displays the population difference. <br/>
          <input id="chkT1" name="template" type="radio"/>
          <label for="chkT1">Template 1</label>
          <br />
          <input id="chkT2" name="template" type="radio"/>
          <label for="chkT2">Template 2</label>
        </p>
      </div>
      <div id="mapDiv" data-dojo-type="dijit/layout/ContentPane" data-dojo-props="region:'center'"></div>
    </div>
  </body>

</html>
- Mark as New
- Bookmark
- Subscribe
- Mute
- Subscribe to RSS Feed
- Permalink
And I know some may ask why would I ever want to redirect the parent page, which contains the map - I know, I am not crazy about this, either, but our requirements are that we cannot open tabs or pop-ups, unfortunately... we must redirect the parent (maps are embedded within an iFrame).
- Mark as New
- Bookmark
- Subscribe
- Mute
- Subscribe to RSS Feed
- Permalink
Chris,
This sample demonstrates a popup hyperlink that send the apps current page to the hyperlinks url. I could have shortened up the code a bit but I choose to use an existing API sample.
<!DOCTYPE html>
<html>
  <head>
    <meta http-equiv="Content-Type" content="text/html; charset=utf-8">
    <!--The viewport meta tag is used to improve the presentation and behavior of the samples
      on iOS devices-->
    <meta name="viewport" content="initial-scale=1, maximum-scale=1,user-scalable=no">
    <title>Formatter Function</title>

    <link rel="stylesheet" href="http://js.arcgis.com/3.13/dijit/themes/soria/soria.css">
    <link rel="stylesheet" href="http://js.arcgis.com/3.13/dojox/layout/resources/ExpandoPane.css">
    <link rel="stylesheet" href="http://js.arcgis.com/3.13/esri/css/esri.css">
    <style>
      html, body { height: 100%; width: 100%; margin: 0; padding: 0; }
    </style>

    <script src="http://js.arcgis.com/3.13/"></script>
    <script>
      // infotemplate formatting functions need to be in the global scope to work
      var map, compare, compare2;

      require([
        "esri/map",
        "esri/InfoTemplate",
        "esri/layers/FeatureLayer",
        "esri/renderers/SimpleRenderer",
        "esri/symbols/SimpleFillSymbol",
        "esri/symbols/SimpleLineSymbol",
        "dojo/dom",
        "dojo/number",
        "dojo/on",
        "dojo/parser",
        "esri/Color",
        "dijit/layout/BorderContainer",
        "dijit/layout/ContentPane",
        "dojox/layout/ExpandoPane",
        "dojo/domReady!"
      ],
        function (
          Map, InfoTemplate, FeatureLayer, SimpleRenderer, SimpleFillSymbol,
          SimpleLineSymbol, dom, number, on, parser, Color
      ) {

          parser.parse();

          map = new Map("mapDiv", {
            basemap: "streets",
            center: [-86.796, 47.13],
            zoom: 7
          });

          var infoTemplate = new InfoTemplate();
          infoTemplate.setTitle("Population in ${NAME}");
          infoTemplate.setContent("<b>2007 :D: </b>${POP2007:compare}<br/>" +
                                  "<b>2007 density: </b>${POP07_SQMI:compare}<br/><br/>" +
                                  "<b>2000: </b>${POP2000:NumberFormat}<br/>" +
                                  "<b>2000 density: </b>${POP00_SQMI:NumberFormat}<br/><br/>" +
                                  "<a target='_self' href=http://en.wikipedia.org/wiki/Olea_europaea>Wikipedia Entry</a>");

          var counties = new FeatureLayer("http://sampleserver1.arcgisonline.com/ArcGIS/rest/services/Demographics/ESRI_Census_USA/MapServer/3", {
            mode: FeatureLayer.MODE_SNAPSHOT,
            infoTemplate: infoTemplate,
            outFields: [
              "NAME", "POP2000", "POP2007", "POP00_SQMI",
              "POP07_SQMI"
            ]
          });

          counties.setDefinitionExpression("STATE_NAME = 'Michigan'");

          //apply a renderer
          var symbol = new SimpleFillSymbol(SimpleFillSymbol.STYLE_SOLID,
            new SimpleLineSymbol(SimpleLineSymbol.STYLE_SOLID,
              new Color([255, 255, 255, 0.35]), 1),
            new Color([109, 146, 155, 0.35]));
          counties.setRenderer(new SimpleRenderer(symbol));

          map.addLayer(counties);

          on(dom.byId("chkT1"), "click", changeInfoTemplate);
          on(dom.byId("chkT2"), "click", changeInfoTemplate);

          dom.byId("chkT1").checked = true;

          compare = function (value, key, data) {
            var result = "", diff, pctChange;

            switch (key) {
              case "POP2007":
                result = value > data.POP2000 ? "images/up.png" : "images/down.png";
                diff = data.POP2007 - data.POP2000;
                pctChange = (diff * 100) / data.POP2000;
                break;

              case "POP07_SQMI":
                result = value > data.POP00_SQMI ? "images/up.png" : "images/down.png";
                diff = data.POP07_SQMI - data.POP00_SQMI;
                pctChange = (diff * 100) / data.POP00_SQMI;
                break;
            }

            return number.format(value) +
                   "   <img src='" + result + "'/>" +
                   "  <span style='color: " +
                   (pctChange < 0 ? "red" : "green") + ";'>"
                     + number.format(pctChange, { places: 3 }) +
                   "%</span>";
          };

          compare2 = function (value, key, data) {
            var diff = data.POP2007 - data.POP2000;
            var result = diff > 0 ? "images/up.png" : "images/down.png";
            var pctChange = (diff * 100) / data.POP2000;

            return "<img src='" + result + "'/>" +
                   "  <span style='color: " +
                   (pctChange < 0 ? "red" : "green") + ";'>"
                     + number.format(pctChange, { places: 3 }) +
                   "%</span>";
          };

          function changeInfoTemplate () {
            console.log("changed");
            map.infoWindow.hide();

            var t1Checked = dom.byId("chkT1").checked;
            var t2Checked = dom.byId("chkT2").checked;
            var templateContent = "";

            if (t1Checked) {
              templateContent = "<b>2007: </b>${POP2007:compare}<br/>" +
                                "<b>2007 density: </b>${POP07_SQMI:compare}<br/><br/>" +
                                "<b>2000: </b>${POP2000:NumberFormat}<br/>" +
                                "<b>2000 density: </b>${POP00_SQMI:NumberFormat}<br/>" +
                                "<a target='_self' href=http://en.wikipedia.org/wiki/Olea_europaea>Wikipedia Entry</a>";
            }
            else if (t2Checked) {
              templateContent = "<b>2007: </b>${POP2007}<br/>" +
                                "<b>2007 density: </b>${POP07_SQMI}<br/><br/>" +
                                "<b>2000: </b>${POP2000:NumberFormat}<br/>" +
                                "<b>2000 density: </b>${POP00_SQMI:NumberFormat}<br/><br/>" +
                                "Diff: ${DIFF:compare2}<br/>" +
                                "<a target='_self' href=http://en.wikipedia.org/wiki/Olea_europaea>Wikipedia Entry</a>";
            }

            counties.infoTemplate.setContent(templateContent);
          }
        });
    </script>
  </head>
  <body class="soria">
    <div data-dojo-type="dijit/layout/BorderContainer"
         data-dojo-props="design:'headline', gutters:true"
         style="width: 100%; height: 100%; margin: 0;">

      <div data-dojo-type="dojox/layout/ExpandoPane"
           data-dojo-props="duration:300, title:'Details', region:'left', maxWidth:'220px', easeIn:'easing.linear', easeOut:'easing.linear'"
           style="width:220px;">
         <p>
          Click a county to view the population change between 2000 and 2007.<br/> <br/>
          <b>Change the info template:</b> Template 1 displays the percentage growth (or decline) in population. The values are color-coded green for population increase and red for decline in population. Template 2 creates a new calculated field called diff that displays the population difference. <br/>
          <input id="chkT1" name="template" type="radio"/>
          <label for="chkT1">Template 1</label>
          <br />
          <input id="chkT2" name="template" type="radio"/>
          <label for="chkT2">Template 2</label>
        </p>
      </div>
      <div id="mapDiv" data-dojo-type="dijit/layout/ContentPane" data-dojo-props="region:'center'"></div>
    </div>
  </body>

</html>
- Mark as New
- Bookmark
- Subscribe
- Mute
- Subscribe to RSS Feed
- Permalink
Thanks - I had a feeling we'd probably have to go this route. I'll give it a go...
- Mark as New
- Bookmark
- Subscribe
- Mute
- Subscribe to RSS Feed
- Permalink
This worked well...