- Home
- :
- All Communities
- :
- Developers
- :
- JavaScript Maps SDK
- :
- JavaScript Maps SDK Questions
- :
- Re: Identify Feature by hovering over
- Subscribe to RSS Feed
- Mark Topic as New
- Mark Topic as Read
- Float this Topic for Current User
- Bookmark
- Subscribe
- Mute
- Printer Friendly Page
Identify Feature by hovering over
- Mark as New
- Bookmark
- Subscribe
- Mute
- Subscribe to RSS Feed
- Permalink
Hi, I can easily identify a feature on layer by using onClick and Identifytask. However I would like to identify a feature of specific layers in a map service by hovering over instead of clicking. I tried using a QueryTask but I'm not really querying the layer (I don't have a where). Which method is the best to use?
- Mark as New
- Bookmark
- Subscribe
- Mute
- Subscribe to RSS Feed
- Permalink
Check out this sample: Feature Layer - display results as an InfoWindow onHover
Essentially you need to respond to the mouse-over and mouse-out events for each layer to apply the hover info. The sample shows how this is done.
- Mark as New
- Bookmark
- Subscribe
- Mute
- Subscribe to RSS Feed
- Permalink
Thank you, it's not quite working for me with the map service I am using. How do you paste javascript into a reply?
- Mark as New
- Bookmark
- Subscribe
- Mute
- Subscribe to RSS Feed
- Permalink
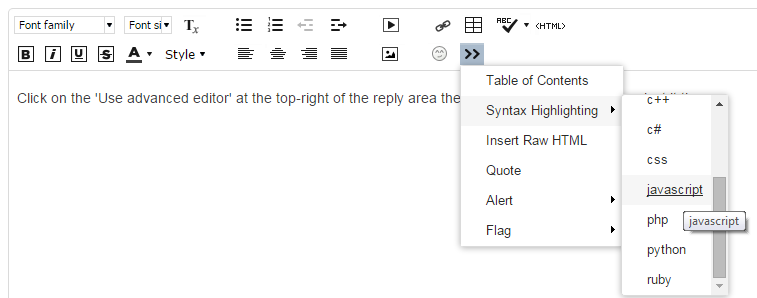
To paste a code block click on the 'Use advanced editor' at the top-right of the reply area then you can paste your code, select it then pick Javascript from the Syntax Highlighting options:
- Mark as New
- Bookmark
- Subscribe
- Mute
- Subscribe to RSS Feed
- Permalink
I took the code from example altered to use my map service, I am missing something because I can't get mouse move to fire.
 var map, dialog;

"esri/map", "esri/layers/FeatureLayer",

"esri/symbols/SimpleFillSymbol", "esri/symbols/SimpleLineSymbol",

"esri/renderers/SimpleRenderer", "esri/graphic", "esri/lang",

"esri/Color", "dojo/number", "dojo/dom-style",

"dijit/TooltipDialog", "dijit/popup", "dojo/domReady!"


function (

new Map("mapDiv", {

"streets",

false


var southCarolinaCounties = new FeatureLayer("http://gisappserv3/ArcGIS/rest/services/Engineering/MaintenancePoints/MapServer", {

"District"]

//          southCarolinaCounties.setDefinitionExpression("STATE_NAME = 'Washington'");


var symbol = new SimpleFillSymbol(

new SimpleLineSymbol(

new Color([255, 255, 255, 0.35]),

new Color([125, 125, 125, 0.35])

new SimpleRenderer(symbol));

new TooltipDialog({

"tooltipDialog",

"position: absolute; width: 250px; font: normal normal normal 10pt Helvetica;z-index:100"


var highlightSymbol = new SimpleFillSymbol(

new SimpleLineSymbol(

new Color([255, 0, 0]), 3

new Color([125, 125, 125, 0.35])

//close the dialog when the mouse leaves the highlight graphic


"load", function () {

"mouse-out", closeDialog);

//listen for when the onMouseOver event fires on the countiesGraphicsLayer


//when fired, create a new graphic with the geometry from the event.graphic and add it to the maps graphics layer


"mouse-over", function (evt) {

'here');

var t = "<b>${District}</b>";

var content = esriLang.substitute(evt.graphic.attributes, t);

var highlightGraphic = new Graphic(evt.graphic.geometry, highlightSymbol);

"opacity", 0.85);

function closeDialog() {
- Mark as New
- Bookmark
- Subscribe
- Mute
- Subscribe to RSS Feed
- Permalink
Also...I have different layers in my map service, and I am trying to hover over a point.
- Mark as New
- Bookmark
- Subscribe
- Mute
- Subscribe to RSS Feed
- Permalink
Also are you sure that this is the right url?
http://gisappserv3/ArcGIS/rest/services/Engineering/MaintenancePoints/MapServer
It wont open
- Mark as New
- Bookmark
- Subscribe
- Mute
- Subscribe to RSS Feed
- Permalink
Yes I'm sure it is correct. Not sure if there is security on it?
- Mark as New
- Bookmark
- Subscribe
- Mute
- Subscribe to RSS Feed
- Permalink
It looks like this works on your internal network because you are accessing just by the server name and not by a regular domain name. I would make sure DNS is set-up and your services are forward-facing from outside of your network.