- Home
- :
- All Communities
- :
- Developers
- :
- JavaScript Maps SDK
- :
- JavaScript Maps SDK Questions
- :
- Re: I need some help to get some code to work
- Subscribe to RSS Feed
- Mark Topic as New
- Mark Topic as Read
- Float this Topic for Current User
- Bookmark
- Subscribe
- Mute
- Printer Friendly Page
I need some help to get some code to work
- Mark as New
- Bookmark
- Subscribe
- Mute
- Subscribe to RSS Feed
- Permalink
Hi i am trying to get some code to work I have it commented out for now and have the map part working and the layer list i think working but i need the results below. Any help small or large would be awesome.

the two rest services i need to use are as follows
for the states in red and blue use this one
http://localhost:6080/arcgis/rest/services/USA_Congress_Party_111/MapServer
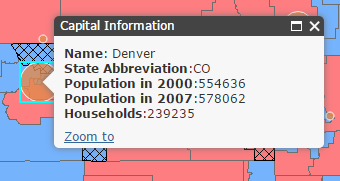
for the Orange circles which represent capital cities use this
http://localhost:6080/arcgis/rest/services/State_Capitals/MapServer
I dont know if the maps will display seeing how this is being done on a virtual machine, with arcgis server at a university. But if you could tell me or comment to me what i am missing to get these results above. I would be greatful. Currently in my code i am using a mapID of the rest service above for the red and blue map.
My code is attached as a file.
Here are some pics for the layerlist/symbology
1. The bottom-left region of the web page is divided into two panes further.
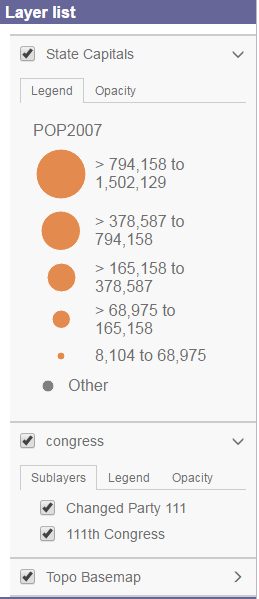
2. The top pane shows a layer list, which includes all layers in the map (basemap, operational layers and their sublayers).Every layer should have a meaningful name. On the layer list, you can use checkbox to control the visibility of each layer. A legend and an opacity slider are also listed when you expand each layer. The legend should be updated accordingly as the visibility or the symbology of the layers change.
3. The bottom pane is used to control the symbology of the capital cities layer. Two drop-down lists should be provided. When users change any option, the layer symbology in the map should reflect the change immediately. The default options of the drop-down lists should be used to render the initial map.
a. Attribute list: three attributes in the capital
cities layer should be available,
including 1) population in 2007, 2)
household number, and 3) house
vacancy. Based on the selected
attribute, the cities are classified
and symbolized.
b. Classification method list: Three data classification methods should be available, including 1) natural breaks; 2) equal interval; and 3) quantile. A total of 5 classes will be created no matter which classification method is selected

- Mark as New
- Bookmark
- Subscribe
- Mute
- Subscribe to RSS Feed
- Permalink
The require list and the function parameter does not match. The ClassBreaksRenderer and domStyle is out of order.
Hope this is helpful. I shall continue reviewing.
- Mark as New
- Bookmark
- Subscribe
- Mute
- Subscribe to RSS Feed
- Permalink
Can anyone help with this, I am in need of some desperate help. I am close to finishing this, just running into some problems.
- Mark as New
- Bookmark
- Subscribe
- Mute
- Subscribe to RSS Feed
- Permalink
Richard,
You have a long way to go but this will get you started (with adding your layers to the map and getting your requires fixed):
<!DOCTYPE html>
<html>

<head>
    <meta http-equiv="Content-Type" content="text/html; charset=utf-8">
    <meta name="viewport" content="initial-scale=1, maximum-scale=1,user-scalable=no">
    <title>Layer List Dijit</title>
    <link rel="stylesheet" href="https://js.arcgis.com/3.16/dijit/themes/claro/claro.css">
    <link rel="stylesheet" href="https://js.arcgis.com/3.16/esri/css/esri.css">

    <style>
        html,
        body,
        .container,
        #map {
            height: 100%;
            width: 100%;
            margin: 0;
            padding: 0;
            margin: 0;
            font-family: "Open Sans";
        }

        #title {
            background-color: #478;
        }

        #map {
            padding: 0;
        }

        #layerListPane {
            width: 25%;
        }

        .esriLayer {
            background-color: #fff;
        }

        .esriLayerList .esriList {
            border-top: none;
        }

        .esriLayerList .esriTitle {
            background-color: #fff;
            border-bottom: none;
        }

        .esriLayerList .esriList ul {
            background-color: #fff;
        }
    </style>
    <script>
        var dojoConfig = {
            parseOnLoad: true
        };
    </script>
    <script src="https://js.arcgis.com/3.16/"></script>
    <script>
        var map, myWidget;
        require([
            "esri/map",
            "esri/layers/FeatureLayer",
            "esri/InfoTemplate",
            "esri/symbols/SimpleFillSymbol",
            "esri/renderers/ClassBreaksRenderer",
            "esri/Color",
            "dojo/dom-style",
            "dojo/_base/array",
            "dojo/dom",
            "dojo/number",
            "dojo/on",
            "esri/basemaps",
            "esri/dijit/Basemap",
            "esri/dijit/BasemapGallery",
            "esri/dijit/ColorInfoSlider",
            "esri/dijit/util/busyIndicator",
            "esri/plugins/FeatureLayerStatistics",
            "esri/renderers/smartMapping",
            "esri/symbols/SimpleLineSymbol",
            "esri/arcgis/utils",
            "esri/dijit/LayerList",
            "esri/layers/ArcGISDynamicMapServiceLayer",
            "dijit/layout/BorderContainer",
            "dijit/layout/ContentPane",
            "dojo/domReady!"
        ], function(
            Map,
            FeatureLayer,
            InfoTemplate,
            SimpleFillSymbol,
            ClassBreaksRenderer,
            Color,
            domStyle,
            array,
            dom,
            number,
            on,
            esriBasemaps,
            Basemap,
            BasemapGallery,
            ColorInfoSlider,
            busyIndicator,
            FeatureLayerStatistics,
            smartMapping,
            SimpleLineSymbol,
            arcgisUtils,
            LayerList,
            ArcGISDynamicMapServiceLayer
        ) {
            //Added the lines up to line 80
            map = new Map("map", {
              basemap: "streets",
              center: [-98.215, 38.382],
              zoom: 7,
              slider: false
            });

            var symbol = new SimpleFillSymbol();
            symbol.setColor(new Color([150, 150, 150, 0.5]));

            var congressLayer = new ArcGISDynamicMapServiceLayer("http://localhost:6080/arcgis/rest/services/USA_Congress_Party_111/MapServer",{id:"Congress"});
            var stateCapitalsLayer = new ArcGISDynamicMapServiceLayer("http://localhost:6080/arcgis/rest/services/State_Capitals/MapServer",{id:"State Capitals"});
            map.on("layers-add-result", function(layers){
              var llLayers = array.map(layers, function(layer){
                return {
                  id: layer.id,
                  layer: layer,
                  showLegend: true,
                  showOpacitySlider: true,
                  showSubLayers: true
                }
              });
              var baseMap = map.getLayer(map.layerIds[0]);
              baseMap.id = "StreetMap";
              myWidget = new LayerList({
                  map: map,
                  layers: llLayers,
                  showLegend: true,
                  showOpacitySlider: true,
                  showSubLayers: true
              }, "layerList");
              myWidget.startup();
            })
            map.addLayers([congressLayer, stateCapitalsLayer]);

            //render the feature layer with classes size renderer(smartMapping)
            function createRenderer(layer, attribute, classification){
              var rendererParams = {
                field: attribute,
                layer: layer,
                classificationMethod: classification,
                basemap: map.getBasemap(),
                numClasses: 5
              };
              smartMapping.createClassedSizeRenderer(rendererParams).then(
                function(response){
                  layer.setRenderer(response.renderer);
                  layer.redraw();
                  layerList.refresh();
                }
              );
            }
        });
    </script>
</head>

<body class="claro">
    <div id="mainWindow" data-dojo-type="dijit/layout/BorderContainer" data-dojo-props="design:'headline'" style="width:100%; height:100%;">
        <div id="title" class="shadow roundedCorners" data-dojo-type="dijit/layout/ContentPane" data-dojo-props="region:'top'">
            <h2><b>U.S. 111th Congress Map</b></h2>
        </div>
        <div id="layerListPane" data-dojo-type="dijit/layout/ContentPane" data-dojo-props="region:'left'">
            <div id="layerList"></div>
        </div>
        <div id="map" data-dojo-type="dijit/layout/ContentPane" data-dojo-props="region:'center'"></div>
    </div>
</body>

</html>
- Mark as New
- Bookmark
- Subscribe
- Mute
- Subscribe to RSS Feed
- Permalink
Thanks, that has helped a ton, and i just figured out the drop downs, so moving along thank you.