- Home
- :
- All Communities
- :
- Developers
- :
- JavaScript Maps SDK
- :
- JavaScript Maps SDK Questions
- :
- Re: How to save the user's graphic to feature clas...
- Subscribe to RSS Feed
- Mark Topic as New
- Mark Topic as Read
- Float this Topic for Current User
- Bookmark
- Subscribe
- Mute
- Printer Friendly Page
How to save the user's graphic to feature class?
- Mark as New
- Bookmark
- Subscribe
- Mute
- Subscribe to RSS Feed
- Permalink
I want to save user's drawn graphic, which may be polygons, lines, points, text and etc. (drawing tools) into a feature class (stored in a SDE SQL server). However, I found that if I want to do such thing, I have to define the feature type first (template picker), so I can use the applyEdits() to save the changes...My question is, does the graphic layer also support applyEdit?
Solved! Go to Solution.
Accepted Solutions
- Mark as New
- Bookmark
- Subscribe
- Mute
- Subscribe to RSS Feed
- Permalink
Unlike a feature layer, a graphic layer has no backing feature class - they only exist in the context of the map in the web browser.
The applyEdits() method is only available on feature layers. If you go down this path to store graphics (geometries) you would also need separate feature services for each geometry type.
You could write custom functionality to store each graphic (or a collection of graphics) as a JSON object in your database. If you want to display the saved changes at a later stage you would also need custom JS functions to add graphics back into a graphics layer on the map from your database.
As far as I am aware this functionality is not available without custom JS and server-side code.
- Mark as New
- Bookmark
- Subscribe
- Mute
- Subscribe to RSS Feed
- Permalink
Hi Owen, thanks for your reply! Is it possible to store the graphics such as "esri.symbol.TextSymbol"? I found that I can only pre-defined some feature type with points, lines, polygons etc...but there is no text symbol
- Mark as New
- Bookmark
- Subscribe
- Mute
- Subscribe to RSS Feed
- Permalink
You could create a custom JSON object containing your text symbol and its location (point geometry), for example:
{
"pt":{
     "type":"point",
     "x":-13046161.8651223,
     "y":4036389.8461467917,
     "spatialReference":{"wkid":102100,"latestWkid":3857}},
"txt":{
     "type":"textsymbol",
     "x":0,
     "y":0,
     "text":"380 New York St, Redlands, California, 92373",
     "rotated":false,
     "kerning":true,
     "color":{"b":102,"g":102,"r":102,"a":1},
     "font":{
          "size":14,
          "style":"normal",
          "variant":"normal",
          "weight":"bold",
          "family":"Helvetica"},
     "horizontalAlignment":"center",
     "align":"middle",
     "xoffset":0,
     "yoffset":8
}}
This could be stored in the database for each text element. To create the data to store you could use a function like this:
        // Create a custom JSON object
        function textSymbolToJSON(pt, ts) {
              var txtSym = {
                "pt":pt,
                "txt":ts
              };
              return JSON.stringify(txtSym);
        }
Pass the Point and TextSymbol into the function and store the JSON string in your database.
To build the text symbol from the JSON object again use something like this:
        // Create the text symbol from JSON data
        function textSymbolFromJSON(json) {
            var obj = JSON.parse(json);
            var pt = new Point(obj.pt);
            var ts = new TextSymbol(obj.txt);
            map.graphics.add(new Graphic(pt, ts));
        }
I have created a basic sample of this concept (without a database). Open the sample page, click on Locate - this will populate the custom JSON data. Try modifying the custom JSON data directly then click on Recreate to view the results.
Hope this helps,
Owen
- Mark as New
- Bookmark
- Subscribe
- Mute
- Subscribe to RSS Feed
- Permalink
Thanks for your sample code, it helps me easier to understand the different between graphics and features. May I ask you one more questions? Thank you.
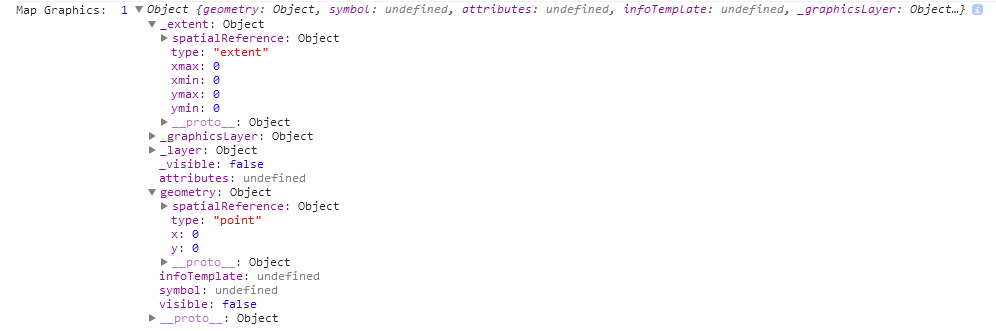
As I notice that even the map is just initialized, the length of map.graphics.graphics is always greater than 0, since there is one point object with x,y = 0,0. Why do I get this point?
- Mark as New
- Bookmark
- Subscribe
- Mute
- Subscribe to RSS Feed
- Permalink
As I notice that even the map is just initialized, the length of map.graphics.graphics is always greater than 0, since there is one point object with x,y = 0,0. Why do I get this point?
I have never noticed that before. However, after running a quick test I can confirm that there is a single graphic in the graphics layer of a brand new map.
Can someone at ESRI comment on this? - Jim Barry