- Home
- :
- All Communities
- :
- Developers
- :
- JavaScript Maps SDK
- :
- JavaScript Maps SDK Questions
- :
- Re: How to get individual graphic symbol size when...
- Subscribe to RSS Feed
- Mark Topic as New
- Mark Topic as Read
- Float this Topic for Current User
- Bookmark
- Subscribe
- Mute
- Printer Friendly Page
How to get individual graphic symbol size when Smart Mapping - Counts and Amounts (By Size) is used
- Mark as New
- Bookmark
- Subscribe
- Mute
- Subscribe to RSS Feed
- Permalink
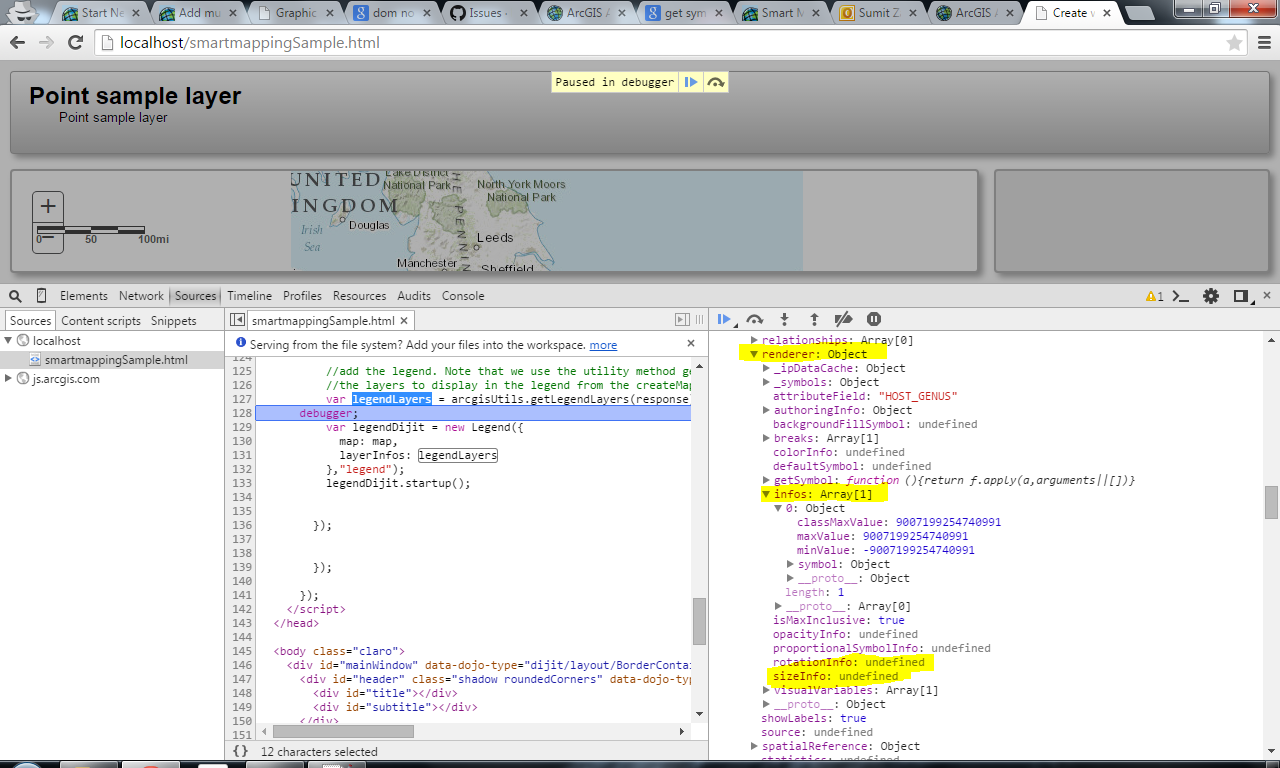
When we apply smart mapping style - Counts and Amounts (By Size) to a point layer (without any classes defined), we are not able to interrogate the size of the graphic symbol. We were expecting the layer's renderer info to have this information. However, the closest thing we could find are only the parameters used by the style i.e., minDatavalue, maxDatavalue, minSize and maxSize in renderer -> visualVariables. The actual size that is used to display the graphic is not listed in the rendererInfo anywhere.
We need to identify the size of a graphic symbol in order to show a cyan colored square selection symbol that is slightly larger than the graphic's symbol, the way it is displayed in ArcGIS Map Viewer.
The cyan colored square selection graphic is added to separate graphic layer on top of the feature layer.
- We cannot use the popup to do this as we need to display the popup contents in a custom way in a side panel.
- We also cannot directly get the graphic's size from the graphic available in feature layer (using getnode) because the graphic is not guaranteed to be always present in featurelayer as its loaded in On-Demand mode.
Is there another way to find out the feature's graphic symbol size? or maybe calculate the size based on parameters defined in rendererInfo?
Here is a sample webmap that uses this style.
http://www.arcgis.com/home/webmap/viewer.html?webmap=3f9fc16b8ab94b0698c738a0c9a71c72
Solved! Go to Solution.
Accepted Solutions
- Mark as New
- Bookmark
- Subscribe
- Mute
- Subscribe to RSS Feed
- Permalink
You can get details about the graphic's shape using the graphic's getDojoShape() method. However in your situation I'd just let the feature layer handle this behavior. You can specify that you do not want popups to display when you click on a feature but still allow the events associated with the popup, like selecting and highlighting the feature, to occur. We have a sample in the help called Popup content in side panel that shows this behavior.
If you'd like to change the popup's highlight symbol you can do that too. Here's a simple sample that shows this:
- Mark as New
- Bookmark
- Subscribe
- Mute
- Subscribe to RSS Feed
- Permalink
Thanks Kelly Hutchins
Using graphic.getShape() method [Graphic | API Reference | ArcGIS API for JavaScript ] we are now able to get the size of symbol, and draw desired highlight graphic on graphicsLayer.