- Home
- :
- All Communities
- :
- Developers
- :
- JavaScript Maps SDK
- :
- JavaScript Maps SDK Questions
- :
- Re: How to display elements in 'DOM' console
- Subscribe to RSS Feed
- Mark Topic as New
- Mark Topic as Read
- Float this Topic for Current User
- Bookmark
- Subscribe
- Mute
- Printer Friendly Page
- Mark as New
- Bookmark
- Subscribe
- Mute
- Subscribe to RSS Feed
- Permalink
Hi everyone,
In order to understand how some functions work and to know the structure of the result of functions, I wanna display them in my 'DOM' console in the 'Inspect element' functionality, I have found accidentally this in my 'DOM' :
How can I do the same thing for every variable ?
EDIT: of course I've tried console.log(featureLayer) id gives me "[Object Object]" which is not helpful for sure, as example I wanna get the structure of the result of this function " RelatedRecords" that I can use it properly (I wan it to show me a structure like in the screen above)
Solved! Go to Solution.
Accepted Solutions
- Mark as New
- Bookmark
- Subscribe
- Mute
- Subscribe to RSS Feed
- Permalink
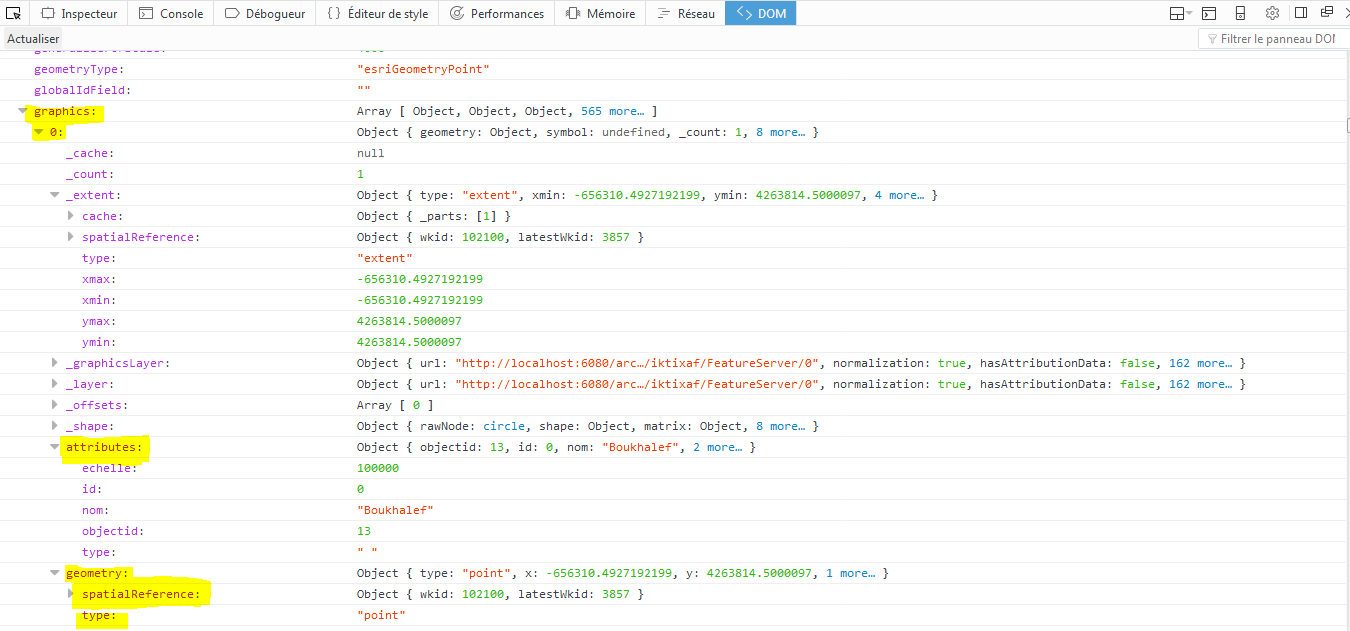
When I print to the console in firefox I get something like this:

I can then click on the Object link at the starting of the line to open the panel on the right that lists all the properties on that object. Does this not work for you? Also, consider trying console.dir(featureLayer).
- Mark as New
- Bookmark
- Subscribe
- Mute
- Subscribe to RSS Feed
- Permalink
Different browsers have different dev tools setups and I'm not sure exactly what I'm looking at here.
In general, you can print anything to the console using console.log(x, y, z) where x, y, and z are variables in your JavaScript code. This is generally the easiest way to see what's going on, in my opinion. If you console.log an object or an array, most dev tool consoles that I'm aware of give you this kind of interface so you can "inspect" the properties of the object by clicking on them to view the value of each property.
My feeling is that the DOM inspector in your screenshot is probably the JavaScript global object (also known as window), which is the global scope where your code is run. Everything should be accessible in the global scope, but it's very large and will be a pain to look through since the entire JavaScript standard library is there.
I'm not sure what you mean by "functions." If you mean functions/methods in the JS API, these are minified, which means the source code won't be easy to read. Some browsers (maybe all?) give you the option to unminify source code. In chrome, you can do this via the "sources" tab in chrome dev tools. In general though, you can't count on being able to read the JS API source code.
- Mark as New
- Bookmark
- Subscribe
- Mute
- Subscribe to RSS Feed
- Permalink
I have edited my post responding on your questions
- Mark as New
- Bookmark
- Subscribe
- Mute
- Subscribe to RSS Feed
- Permalink
When I print to the console in firefox I get something like this:
I can then click on the Object link at the starting of the line to open the panel on the right that lists all the properties on that object. Does this not work for you? Also, consider trying console.dir(featureLayer).
- Mark as New
- Bookmark
- Subscribe
- Mute
- Subscribe to RSS Feed
- Permalink
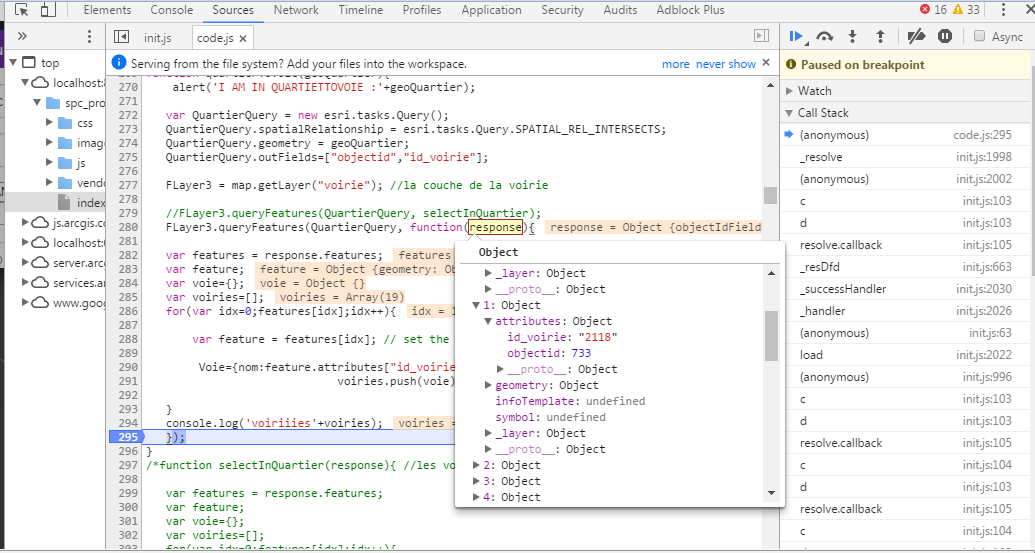
Thank you Thomas,
I have found another ways which is debugging on Chrome, I add a break point in my code through Chrome in the "Sources" Tab and I hover the variable, the image shows How that can be done for those interested :