- Home
- :
- All Communities
- :
- Developers
- :
- JavaScript Maps SDK
- :
- JavaScript Maps SDK Questions
- :
- Hiding feature layer out side of boundary feature ...
- Subscribe to RSS Feed
- Mark Topic as New
- Mark Topic as Read
- Float this Topic for Current User
- Bookmark
- Subscribe
- Mute
- Printer Friendly Page
Hiding feature layer out side of boundary feature layer using javascript api
- Mark as New
- Bookmark
- Subscribe
- Mute
- Subscribe to RSS Feed
- Permalink
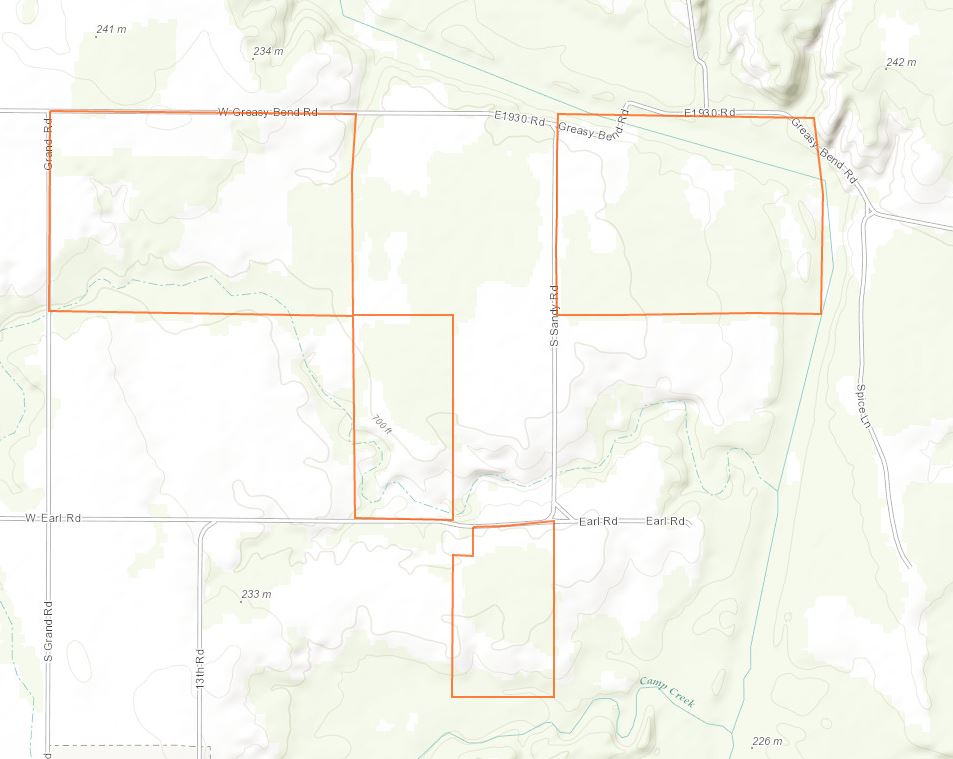
I have a two feature layer; property boundary and pond layer. I am developing javascript application that shows the two layers. I made hollow to the polygon boundary layer that helps to see pond layer overlaid on it. However is there way I can just display the ponds inside the property boundary layer without displaying outside of boundary layer. Any reference or code samples will be appreciated. Thanks
Solved! Go to Solution.
Accepted Solutions
- Mark as New
- Bookmark
- Subscribe
- Mute
- Subscribe to RSS Feed
- Permalink
Yes, you can do this with polygon data. You will just need to use the Polygon class rather than the Point class. The below example selects all counties that intersect the state of Florida.
<!DOCTYPE html>
<html>
  <head>
    <meta http-equiv="Content-Type" content="text/html; charset=utf-8">

    <!--The viewport meta tag is used to improve the presentation and behavior of the samples
      on iOS devices-->
    <meta name="viewport" content="initial-scale=1, maximum-scale=1,user-scalable=no">
    <title>Sample Map</title>
    <link rel="stylesheet" href="http://js.arcgis.com/3.15/esri/css/esri.css">

    <style>
      html, body, #mapDiv {
        padding:0;
        margin:0;
        height:100%;
      }
    </style>

    <script src="http://js.arcgis.com/3.15/"></script>
    <script>
      var map;

      require([
        "esri/map", "esri/layers/FeatureLayer",
        "esri/tasks/query", "esri/tasks/QueryTask",
        "esri/geometry/Polygon", "esri/SpatialReference",
        "esri/symbols/SimpleFillSymbol", "esri/symbols/SimpleLineSymbol", "esri/Color", "esri/graphic",
        "dojo/dom", "dojo/on", "dojo/_base/array", "dojo/domReady!"
      ], function(
        Map, FeatureLayer,
        Query, QueryTask,
        Polygon, SpatialReference,
        SimpleFillSymbol, SimpleLineSymbol, Color, Graphic,
        dom, on, array
      ) {
        map = new Map("mapDiv", {
          basemap: "streets",
          center: [-81.6182, 28.3678],
          zoom: 8
        });

        var featureLayer = new FeatureLayer("http://sampleserver6.arcgisonline.com/arcgis/rest/services/USA/MapServer/2",{
            mode: FeatureLayer.MODE_SNAPSHOT,
            outFields: ["*"],
            opacity: 0.75
        });

        featureLayer.setDefinitionExpression("state_name = 'Florida'");

        map.addLayer(featureLayer);

        var query = new Query();
        query.where = ["1=1"];

        featureLayer.queryFeatures(query, function(featureSet) {
          geometry = featureSet.features[0].geometry;

          var query = new Query();
          var queryTask = new QueryTask("http://sampleserver6.arcgisonline.com/arcgis/rest/services/USA/MapServer/3");
          query.geometry = geometry;
          query.returnGeometry = true;

          queryTask.execute(query, function(graphic){
            array.forEach(graphic.features, function(feature){
                var polygonJson = {"rings": feature.geometry.rings, "spatialReference":{"wkid":4326}};
                var polygon = new Polygon(polygonJson);

                var sfs = new SimpleFillSymbol(SimpleFillSymbol.STYLE_SOLID,
                    new SimpleLineSymbol(SimpleLineSymbol.STYLE_DASHDOT,
                    new Color([255,0,0]), 2),new Color([255,255,0,0.25])
                  );


                var graphic = new Graphic(polygon, sfs);

                map.graphics.add(graphic);
            })
          })

        });

      });
    </script>
  </head>

  <body>

    <div id="mapDiv"></div>

  </body>
</html>
- Mark as New
- Bookmark
- Subscribe
- Mute
- Subscribe to RSS Feed
- Permalink
Hey Kushendra,
I think the only way to do this, is by running a query and selecting all ponds that are within a certain Polygon.
ArcGIS API for JavaScript Sandbox instead of the buffer polygon use your polygon.
Once they are selected make the symbology for the ponds that are not selected invisible and the symbology for the selected features what ever you like.
FeatureLayer | API Reference | ArcGIS API for JavaScript
Hope this helps
Tim
- Mark as New
- Bookmark
- Subscribe
- Mute
- Subscribe to RSS Feed
- Permalink
Thanks for the info Tim. I was looking for script where I can interact with feature content to filter out the data on the client side.
- Mark as New
- Bookmark
- Subscribe
- Mute
- Subscribe to RSS Feed
- Permalink
Hi Kushendra,
Below is an example. Using the QueryTask function, only the cities are returned that intersect Miami-Dade county.
<!DOCTYPE html>
<html>
  <head>
    <meta http-equiv="Content-Type" content="text/html; charset=utf-8">

    <!--The viewport meta tag is used to improve the presentation and behavior of the samples
      on iOS devices-->
    <meta name="viewport" content="initial-scale=1, maximum-scale=1,user-scalable=no">
    <title>Sample Map</title>
    <link rel="stylesheet" href="http://js.arcgis.com/3.15/esri/css/esri.css">

    <style>
      html, body, #mapDiv {
        padding:0;
        margin:0;
        height:100%;
      }
    </style>

    <script src="http://js.arcgis.com/3.15/"></script>
    <script>
      var map;

      require([
        "esri/map", "esri/layers/FeatureLayer",
        "esri/tasks/query", "esri/tasks/QueryTask",
        "esri/geometry/Point", "esri/SpatialReference",
        "esri/symbols/SimpleMarkerSymbol", "esri/symbols/SimpleLineSymbol", "esri/Color", "esri/graphic",
        "dojo/dom", "dojo/on", "dojo/_base/array", "dojo/domReady!"
      ], function(
        Map, FeatureLayer,
        Query, QueryTask,
        Point, SpatialReference,
        SimpleMarkerSymbol, SimpleLineSymbol, Color, Graphic,
        dom, on, array
      ) {
        map = new Map("mapDiv", {
          basemap: "streets",
          center: [-81.792107, 26.150807],
          zoom: 8
        });

        var featureLayer = new FeatureLayer("http://sampleserver6.arcgisonline.com/arcgis/rest/services/USA/MapServer/3",{
            mode: FeatureLayer.MODE_SNAPSHOT,
            outFields: ["*"],
            opacity: 0.75
        });

        featureLayer.setDefinitionExpression("name = 'Miami-Dade'");

        map.addLayer(featureLayer);

        var query = new Query();
        query.where = ["1=1"];

        featureLayer.queryFeatures(query, function(featureSet) {
          geometry = featureSet.features[0].geometry;

          var query = new Query();
          var queryTask = new QueryTask("http://sampleserver6.arcgisonline.com/arcgis/rest/services/USA/MapServer/0");
          query.geometry = geometry;
          query.returnGeometry = true;

          queryTask.execute(query, function(graphic){
            array.forEach(graphic.features, function(feature){
                var point = new Point(feature.geometry.x, feature.geometry.y, new SpatialReference({wkid:4326}));
                var simpleMarkerSymbol = new SimpleMarkerSymbol(SimpleMarkerSymbol.STYLE_SQUARE, 10,
                    new SimpleLineSymbol(SimpleLineSymbol.STYLE_SOLID,
                    new Color([255,0,0]), 1),
                    new Color([0,255,0,0.25]));

                var graphic = new Graphic(point, simpleMarkerSymbol);

                map.graphics.add(graphic);
            })
          })

        });

      });
    </script>
  </head>

  <body>

    <div id="mapDiv"></div>

  </body>
</html>
- Mark as New
- Bookmark
- Subscribe
- Mute
- Subscribe to RSS Feed
- Permalink
Jake- that is great. This is something I need however, I experience problem on retrieving the exact polygon geometries. Is there way I can return polygon geometry ( not points) from the feature data that intersect with other polygon layer? In my data, there are numerous property boundaries (polygons) and I need to filter out ponds (polygon) in order to display only within those boundaries. I would be glad to get code snippets if you have. Thank you and appreciated your help
- Mark as New
- Bookmark
- Subscribe
- Mute
- Subscribe to RSS Feed
- Permalink
Yes, you can do this with polygon data. You will just need to use the Polygon class rather than the Point class. The below example selects all counties that intersect the state of Florida.
<!DOCTYPE html>
<html>
  <head>
    <meta http-equiv="Content-Type" content="text/html; charset=utf-8">

    <!--The viewport meta tag is used to improve the presentation and behavior of the samples
      on iOS devices-->
    <meta name="viewport" content="initial-scale=1, maximum-scale=1,user-scalable=no">
    <title>Sample Map</title>
    <link rel="stylesheet" href="http://js.arcgis.com/3.15/esri/css/esri.css">

    <style>
      html, body, #mapDiv {
        padding:0;
        margin:0;
        height:100%;
      }
    </style>

    <script src="http://js.arcgis.com/3.15/"></script>
    <script>
      var map;

      require([
        "esri/map", "esri/layers/FeatureLayer",
        "esri/tasks/query", "esri/tasks/QueryTask",
        "esri/geometry/Polygon", "esri/SpatialReference",
        "esri/symbols/SimpleFillSymbol", "esri/symbols/SimpleLineSymbol", "esri/Color", "esri/graphic",
        "dojo/dom", "dojo/on", "dojo/_base/array", "dojo/domReady!"
      ], function(
        Map, FeatureLayer,
        Query, QueryTask,
        Polygon, SpatialReference,
        SimpleFillSymbol, SimpleLineSymbol, Color, Graphic,
        dom, on, array
      ) {
        map = new Map("mapDiv", {
          basemap: "streets",
          center: [-81.6182, 28.3678],
          zoom: 8
        });

        var featureLayer = new FeatureLayer("http://sampleserver6.arcgisonline.com/arcgis/rest/services/USA/MapServer/2",{
            mode: FeatureLayer.MODE_SNAPSHOT,
            outFields: ["*"],
            opacity: 0.75
        });

        featureLayer.setDefinitionExpression("state_name = 'Florida'");

        map.addLayer(featureLayer);

        var query = new Query();
        query.where = ["1=1"];

        featureLayer.queryFeatures(query, function(featureSet) {
          geometry = featureSet.features[0].geometry;

          var query = new Query();
          var queryTask = new QueryTask("http://sampleserver6.arcgisonline.com/arcgis/rest/services/USA/MapServer/3");
          query.geometry = geometry;
          query.returnGeometry = true;

          queryTask.execute(query, function(graphic){
            array.forEach(graphic.features, function(feature){
                var polygonJson = {"rings": feature.geometry.rings, "spatialReference":{"wkid":4326}};
                var polygon = new Polygon(polygonJson);

                var sfs = new SimpleFillSymbol(SimpleFillSymbol.STYLE_SOLID,
                    new SimpleLineSymbol(SimpleLineSymbol.STYLE_DASHDOT,
                    new Color([255,0,0]), 2),new Color([255,255,0,0.25])
                  );


                var graphic = new Graphic(polygon, sfs);

                map.graphics.add(graphic);
            })
          })

        });

      });
    </script>
  </head>

  <body>

    <div id="mapDiv"></div>

  </body>
</html>
- Mark as New
- Bookmark
- Subscribe
- Mute
- Subscribe to RSS Feed
- Permalink
Jake I did exactly the way you did but still it did not return the pond geometries. In addition, do I need to add layer to display pond layer? It has only displayed boundary layer. You can check the script and let me know if I need anything.
<!DOCTYPE html>
<html>
<head>
<meta http-equiv="Content-Type" content="text/html; charset=utf-8">
<!--The viewport meta tag is used to improve the presentation and behavior of the samples
on iOS devices-->
<meta name="viewport" content="initial-scale=1, maximum-scale=1,user-scalable=no">
<title>Sample Map</title>
<link rel="stylesheet" href="http://js.arcgis.com/3.15/esri/css/esri.css">
<style>
html, body, #mapDiv {
padding:0;
margin:0;
height:100%;
}
</style>
<script src="http://js.arcgis.com/3.15/"></script>
<script>
var map;
require([
"esri/map", "esri/layers/FeatureLayer",
"esri/tasks/query", "esri/tasks/QueryTask",
"esri/geometry/Polygon", "esri/SpatialReference",
"esri/symbols/SimpleFillSymbol", "esri/symbols/SimpleLineSymbol", "esri/Color", "esri/graphic",
"dojo/dom", "dojo/on", "dojo/_base/array", "dojo/domReady!"
], function(
Map, FeatureLayer,
Query, QueryTask,
Polygon, SpatialReference,
SimpleFillSymbol, SimpleLineSymbol, Color, Graphic,
dom, on, array
) {
map = new Map("mapDiv", {
basemap: "topo",
center: [-97.144, 34.174],
zoom: 8
});
var featureLayer = new FeatureLayer("http:xxxx/webgis/rest/services/Cooperators/cooperatorboundaryandpond/FeatureServer/0",{
mode: FeatureLayer.MODE_SNAPSHOT,
outFields: ["*"],
opacity: 0.75
});
featureLayer.setDefinitionExpression("EntityID = '9410'");
map.addLayer(featureLayer);
var query = new Query();
query.where = ["1=1"];
featureLayer.queryFeatures(query, function(featureSet) {
geometry = featureSet.features[0].geometry;
var query = new Query();
var queryTask = new QueryTask("http:xxxx/webgis/rest/services/Cooperators/cooperatorboundaryandpond/FeatureServer/1");
query.geometry = geometry;
query.returnGeometry = true;
queryTask.execute(query, function(graphic){
array.forEach(graphic.features, function(feature){
var polygonJson = {"rings": feature.geometry.rings, "SpatialReference":{wkid:102725}};
var polygon = new Polygon(polygonJson);
var sfs = new SimpleFillSymbol(SimpleFillSymbol.STYLE_SOLID,
new SimpleLineSymbol(SimpleLineSymbol.STYLE_SOLID,
new Color([255,0,0]), 2),new Color([255,255,0,0.25])
);
var graphic = new Graphic(polygon, sfs);
map.graphics.add(graphic);
})
})
});
});
</script>
</head>
<body>
<div id="mapDiv"></div>
</body>
</html>
- Mark as New
- Bookmark
- Subscribe
- Mute
- Subscribe to RSS Feed
- Permalink
Are there any errors reported in the console window (click F12 on your keyboard to open)?
- Mark as New
- Bookmark
- Subscribe
- Mute
- Subscribe to RSS Feed
- Permalink
I did not see any errors jake. Can you check here if anything is missing? Edit fiddle - JSFiddle
- Mark as New
- Bookmark
- Subscribe
- Mute
- Subscribe to RSS Feed
- Permalink
Everything looks correct, but I don't think I'll be able to determine the issue without having access to the services.