- Home
- :
- All Communities
- :
- Developers
- :
- JavaScript Maps SDK
- :
- JavaScript Maps SDK Questions
- :
- Re: FeatureTables name related records fields
- Subscribe to RSS Feed
- Mark Topic as New
- Mark Topic as Read
- Float this Topic for Current User
- Bookmark
- Subscribe
- Mute
- Printer Friendly Page
- Mark as New
- Bookmark
- Subscribe
- Mute
- Subscribe to RSS Feed
- Permalink
Hi,
in ESRI sample FeatureTable - related records | ArcGIS API for JavaScript 3.22 field "groupBySummary"
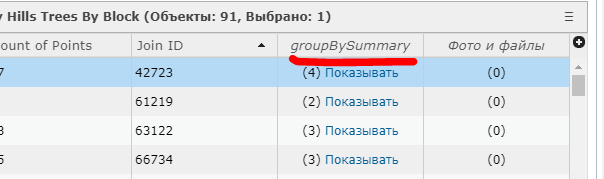
That name for this field?
How can i format it in "fieldInfos" or hide in "HiddenFields" properties?
for example, that I should write in the parameter "name" and so on.
fieldInfos: [
{
name: 'groupBySummary', - ???????????
alias: 'groupBySummary_alias',
}
Thanks.
Solved! Go to Solution.
Accepted Solutions
- Mark as New
- Bookmark
- Subscribe
- Mute
- Subscribe to RSS Feed
- Permalink
Maxim,
OK,
here is the code for that:
myFeatureTable.on("load", function(evt){
//toggle the 9 column to hidden
myFeatureTable.grid.toggleColumnHiddenState(9, true);
var rFldTtile = dojoQuery(".esri-feature-table-column-header-title.esri-feature-table-related-records-title").forEach(function(item, index){
item.innerHTML = "Relate " + index.toString();
});
});- Mark as New
- Bookmark
- Subscribe
- Mute
- Subscribe to RSS Feed
- Permalink
Maxim,
Here is a sample on how to change the column name for the relates and attachments column:
<!DOCTYPE html>
<html>
<head>
<meta http-equiv="Content-Type" content="text/html; charset=utf-8">
<title>FeatureTable - related records</title>
<link rel="stylesheet" href="https://js.arcgis.com/3.22/dijit/themes/claro/claro.css">
<link rel="stylesheet" href="https://js.arcgis.com/3.22/esri/css/esri.css">
<script src="https://js.arcgis.com/3.22/"></script>
<style>
html, body, #map{
width:100%;
height:100%;
margin:0;
padding:0;
}
</style>
<script>
require([
"esri/layers/FeatureLayer",
"esri/dijit/FeatureTable",
"esri/tasks/query",
"esri/geometry/Extent",
"esri/symbols/SimpleFillSymbol",
"esri/symbols/SimpleLineSymbol",
"esri/Color",
"esri/map",
"esri/dijit/Popup",
"esri/dijit/PopupTemplate",
"dojo/dom-construct",
"dojo/dom",
"dojo/number",
"dojo/parser",
"dojo/ready",
"dojo/on",
"dojo/_base/lang",
"dijit/registry",
"dijit/form/Button",
"dijit/layout/ContentPane",
"dijit/layout/BorderContainer",
"dijit/form/TextBox",
"dojo/query"
], function (
FeatureLayer, FeatureTable, Query, Extent, SimpleFillSymbol, SimpleLineSymbol, Color, Map,
Popup, PopupTemplate, domConstruct, dom, dojoNum, parser, ready, on,lang,
registry, Button, ContentPane, BorderContainer, TextBox, dojoQuery
) {
parser.parse();
ready(function(){
var popupOptions = {
marginLeft: "20",
marginTop: "20"
};
// create a popup to replace the map's info window
var popup = new Popup(popupOptions, domConstruct.create("div"));
var map = new Map("map",{
basemap: "topo",
infoWindow: popup,
extent: new Extent({
xmax: -13178092.546668783, xmin: -13180901.607458338,
ymax: 4038066.907666304, ymin: 4036294.524072895,
"spatialReference":{"wkid":102100,"latestWkid":3857}
})
});
map.on("load", loadTable);
function loadTable(){
// create a popup template for Bevery Hills
// Trees by block layer
var popupTemplate = new PopupTemplate({
"title": "Beverly Hills Trees By Block",
"fieldInfos": [{
"fieldName": "Point_Count",
"label": "Count of Points",
"format": {
"places": 0,
"digitSeparator": true
}
}, {
"fieldName": "relationships/0/Point_Count_COMMON",
"label": "Sum of species tree count",
"format": {
"places": 0,
"digitSeparator": true
},
"statisticType": "sum"
}, {
"fieldName": "relationships/0/COMMON",
"label": "Common Name"
}, {
"fieldName": "BLOCKCE10",
"label": "Block"
}],
"description": "There are {Point_Count} trees within census block {BLOCKCE10}",
"showAttachments": false,
"mediaInfos": [{
"title": "Count By Type",
"type": "columnchart",
"caption": "",
"value": {
"theme": "GreySkies",
"fields": ["relationships/0/Point_Count_COMMON"],
"normalizeField": null,
"tooltipField": "relationships/0/COMMON"
}
}]
});
var myFeatureLayer = new FeatureLayer("https://services.arcgis.com/V6ZHFr6zdgNZuVG0/ArcGIS/rest/services/Beverly%20Hills%20Trees%20By%20Blo...",{
mode: FeatureLayer.MODE_ONDEMAND,
infoTemplate: popupTemplate,
outFields: ["*"],
//set the definition expression
definitionExpression: "TRACTCE10 = '700902'",
visible: true,
id: "fLayer"
});
// apply the selection symbol for the layer
var selectionSymbol = new SimpleFillSymbol(SimpleFillSymbol.STYLE_SOLID,
new SimpleLineSymbol(SimpleLineSymbol.STYLE_SOLID,
new Color([255, 0, 0, 0.35]), 1),
new Color([255, 0, 0, 0.35]));
myFeatureLayer.setSelectionSymbol(selectionSymbol);
// listen to featurelayer click event to handle selection
// from layer to the table.
// when user clicks on a feature on the map, the corresponding
// record will be selected in the table.
myFeatureLayer.on("click", function(evt) {
var idProperty = myFeatureLayer.objectIdField;
var feature, featureId, query;
if (evt.graphic && evt.graphic.attributes && evt.graphic.attributes[idProperty]) {
feature = evt.graphic,
featureId = feature.attributes[idProperty];
query = new Query();
query.returnGeometry = false;
query.objectIds = [featureId];
query.where = "1=1";
myFeatureLayer.selectFeatures(query, FeatureLayer.SELECTION_NEW);
}
});
map.addLayer(myFeatureLayer);
// create new FeatureTable and set its properties
var myFeatureTable = new FeatureTable({
featureLayer : myFeatureLayer,
map : map,
syncSelection: true,
showRelatedRecords: true,
showAttachments: true,
fieldInfos: [
{
name: 'AnalysisArea',
alias: 'Area SQ/KM',
editable: false,
format: {
template: "${value}",
places: 3 // number of decimal places
// digitSeparator: true // default is true
}
}
],
// outfields
outFields: ["TRACTCE10", "BLOCKCE10", "GEOID", "NAME", "MTFCC", "ALAND", "AnalysisArea", "Point_Count", "Join_ID"],
}, 'myTableNode');
myFeatureTable.startup();
myFeatureTable.on("load", function(evt){
var rFldTtile = dojoQuery(".esri-feature-table-column-header-title.esri-feature-table-related-records-title")[0].innerHTML = "Relates";
var rFldTtile = dojoQuery(".esri-feature-table-column-header-title.esri-feature-table-attachments-title")[0].innerHTML = "Attachments";
});
// listen to row-click event
// to hide visible popups
myFeatureTable.on("row-select", function(evt){
if (map.infoWindow.isShowing){
map.infoWindow.hide();
}
});
// listen to show-attachments event
myFeatureTable.on("show-attachments", function(evt){
console.log("show-attachments event - ", evt);
});
// listen to show-related-records event
myFeatureTable.on("show-related-records", function(evt){
console.log("show-related-records event - ", evt);
});
}
});
});
</script>
</head>
<body class="claro esri">
<div data-dojo-type="dijit/layout/BorderContainer" data-dojo-props="design:'headline'" style="width:100%; height:100%;">
<div data-dojo-type="dijit/layout/ContentPane" data-dojo-props="region:'center', splitter:true" style="height:60%">
<div id="map"></div>
</div>
<div id="bot" data-dojo-type="dijit/layout/ContentPane" data-dojo-props="region:'bottom', splitter:true" style="height:40%">
<div id="myTableNode"></div>
</div>
</div>
</body>
</html>- Mark as New
- Bookmark
- Subscribe
- Mute
- Subscribe to RSS Feed
- Permalink
Robert, thanks for response !
But how to turn off/on related field without setting the property "showRelatedRecords: false".
I have a few relations, some I need to turn off and some I need to turn on.
- Mark as New
- Bookmark
- Subscribe
- Mute
- Subscribe to RSS Feed
- Permalink
Maxim,
Are you asking how to turn off certain fields in the related data table?
- Mark as New
- Bookmark
- Subscribe
- Mute
- Subscribe to RSS Feed
- Permalink
Robert,
I have several related tables
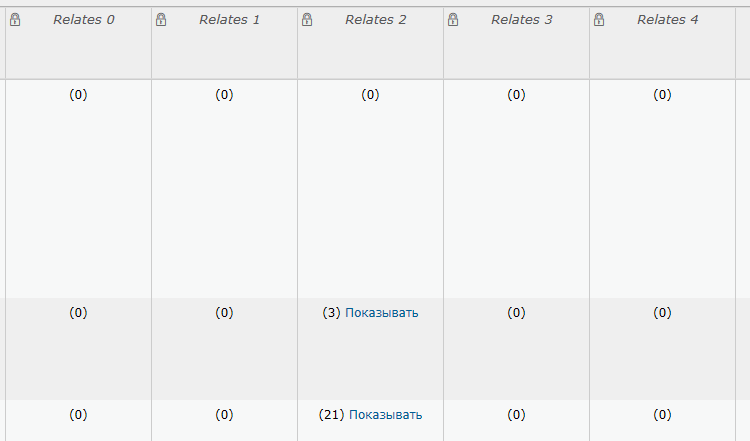
for example, I need to turn off field Relates 0, Relates 1, Relates 4
- Mark as New
- Bookmark
- Subscribe
- Mute
- Subscribe to RSS Feed
- Permalink
Maxim,
OK,
here is the code for that:
myFeatureTable.on("load", function(evt){
//toggle the 9 column to hidden
myFeatureTable.grid.toggleColumnHiddenState(9, true);
var rFldTtile = dojoQuery(".esri-feature-table-column-header-title.esri-feature-table-related-records-title").forEach(function(item, index){
item.innerHTML = "Relate " + index.toString();
});
});- Mark as New
- Bookmark
- Subscribe
- Mute
- Subscribe to RSS Feed
- Permalink
Robert,
many thanks,
and the last question - is how to set width a columns ?
- Mark as New
- Bookmark
- Subscribe
- Mute
- Subscribe to RSS Feed
- Permalink
Maxim,
That is as simple as:
myFeatureTable.grid.resizeColumnWidth(8, 60);Don't forget to mark this question as answered by clicking on the "Mark Correct" link on the reply that answered your question.