- Home
- :
- All Communities
- :
- Developers
- :
- JavaScript Maps SDK
- :
- JavaScript Maps SDK Questions
- :
- attribute edit
- Subscribe to RSS Feed
- Mark Topic as New
- Mark Topic as Read
- Float this Topic for Current User
- Bookmark
- Subscribe
- Mute
- Printer Friendly Page
- Mark as New
- Bookmark
- Subscribe
- Mute
- Subscribe to RSS Feed
- Permalink
Hi all,
I am trying to implement attribute edit using attribute inspector, the service is displaying but pop up info not getting displayed.
If the problem is with the proxy setting, can anybody help with it. i am using IIS server.
here is the code
<!DOCTYPE html>
<html>
<head>
<meta http-equiv="Content-Type" content="text/html; charset=utf-8">
<!--The viewport meta tag is used to improve the presentation and behavior of the samples
on iOS devices-->
<meta name="viewport" content="initial-scale=1, maximum-scale=1,user-scalable=no">
<title>Editable FeatureLayer in Selection Only Mode with Attribute Inspector</title>
<link rel="stylesheet" href="http://js.arcgis.com/3.14/dijit/themes/claro/claro.css">
<link rel="stylesheet" href="http://js.arcgis.com/3.14/esri/css/esri.css">
<style>
html, body {
height: 100%; width: 100%;
margin: 0;
padding: 0;
overflow: hidden;
}
#mapDiv{
margin: 0;
padding:0;
}
#detailPane{
height:20px;
color:#570026;
font-size:12pt;
font-weight:600;
overflow:hidden;
}
.dj_ie .infowindow .window .top .right .user .content { position: relative; }
.dj_ie .simpleInfoWindow .content {position: relative;}
.esriAttributeInspector {height:100px;}
.esriAttributeInspector .atiLayerName {display:none;}
.esriAttributeInspector .atiButton{
margin-top:1px;
margin-right:45px;
}
</style>
<script src="http://js.arcgis.com/3.14/"></script>
<script>
var map;
var updateFeature;
require([
"esri/map",
"esri/layers/FeatureLayer",
"esri/dijit/AttributeInspector",
"esri/symbols/SimpleLineSymbol",
"esri/symbols/SimpleFillSymbol",
"esri/Color",
"esri/layers/ArcGISDynamicMapServiceLayer",
"esri/config",
"esri/tasks/query",
"dojo/query",
"dojo/parser",
"dojo/dom-construct",
"dijit/form/Button",
"dijit/layout/BorderContainer", "dijit/layout/ContentPane", "dojo/domReady!"
], function(
Map, FeatureLayer, AttributeInspector,
SimpleLineSymbol, SimpleFillSymbol, Color,
ArcGISDynamicMapServiceLayer, esriConfig,
Query,dojoQuery,
parser, domConstruct, Button
) {
parser.parse();
// refer to "Using the Proxy Page" for more information: https://developers.arcgis.com/javascript/jshelp/ags_proxy.html
// esriConfig.defaults.io.proxyUrl = "/proxy/";
map = new Map("mapDiv", {
basemap: "streets",
center: [78.20, 19.00],
zoom: 11
});
map.on("layers-add-result", initSelectToolbar);
var petroFieldsMSL = new ArcGISDynamicMapServiceLayer("http://gisserver.cgg.gov.in/arcgis/rest/services/IRR/srsp_canal_WRK1/MapServer");
petroFieldsMSL.setDisableClientCaching(true);
map.addLayer(petroFieldsMSL);
var petroFieldsFL = new FeatureLayer("http://gisserver.cgg.gov.in/arcgis/rest/services/IRR/srsp_canal_WRK1/FeatureServer/1", {
mode: FeatureLayer.MODE_SELECTION,
outFields: ["objectid","code", "codename", "length", "description", "status_work", "la_status", "ip_status"]
});
var selectionSymbol = new SimpleFillSymbol(
SimpleFillSymbol.STYLE_NULL,
new SimpleLineSymbol(
"solid",
new Color("yellow"),
2
),
null
);
petroFieldsFL.setSelectionSymbol(selectionSymbol);
petroFieldsFL.on("edits-complete", function() {
petroFieldsMSL.refresh();
});
map.addLayers([petroFieldsFL]);
function initSelectToolbar(evt) {
var petroFieldsFL = evt.layers[1].layer;
var selectQuery = new Query();
map.on("click", function(evt) {
selectQuery.geometry = evt.mapPoint;
petroFieldsFL.selectFeatures(selectQuery, FeatureLayer.SELECTION_NEW, function(features) {
if (features.length > 0) {
//store the current feature
updateFeature = features[0];
map.infoWindow.setTitle(features[0].getLayer().name);
map.infoWindow.show(evt.screenPoint, map.getInfoWindowAnchor(evt.screenPoint));
}
else {
map.infoWindow.hide();
}
});
});
map.infoWindow.on("hide", function() {
petroFieldsFL.clearSelection();
});
var layerInfos = [
{
'featureLayer': petroFieldsFL,
'showAttachments': false,
'isEditable': true,
'fieldInfos': [
{'fieldName': 'objectid', 'isEditable': false, 'objectid': 'objectid:'},
{'fieldName': 'code', 'isEditable': false, 'CANAL CODE': 'Acreage:'},
{'fieldName': 'codename', 'isEditable': false, 'label': 'CANAL NAME:'},
{'fieldName': 'length', 'isEditable': false, 'label': 'LENGTH IN METERS:'},
{'fieldName': 'description', 'isEditable': false, 'label': 'CANAL DESCRIPTION:'},
{'fieldName': 'status_work', 'isEditable': true, 'tooltip': 'WORK PROGRESS', 'label': 'WORK PROGRESS STATUS:'},
{'fieldName': 'la_status', 'isEditable': true, 'tooltip': 'LAND AQUISITION', 'label': 'LAND AQUISITION STATUS:'},
{'fieldName': 'ip_status', 'isEditable': true, 'tooltip': 'IP CREATED', 'label': 'IP CREATED STATUS:'}
]
}
];
var attInspector = new AttributeInspector({
layerInfos: layerInfos
}, domConstruct.create("div"));
//add a save button next to the delete button
var saveButton = new Button({ label: "Save", "class": "saveButton"},domConstruct.create("div"));
domConstruct.place(saveButton.domNode, attInspector.deleteBtn.domNode, "after");
saveButton.on("click", function() {
updateFeature.getLayer().applyEdits(null, [updateFeature], null);
});
attInspector.on("attribute-change", function(evt) {
//store the updates to apply when the save button is clicked
updateFeature.attributes[evt.fieldName] = evt.fieldValue;
});
attInspector.on("next", function(evt) {
updateFeature = evt.feature;
console.log("Next " + updateFeature.attributes.objectid);
});
attInspector.on("delete", function(evt) {
evt.feature.getLayer().applyEdits(null, null, [evt.feature]);
map.infoWindow.hide();
});
map.infoWindow.setContent(attInspector.domNode);
map.infoWindow.resize(350, 240);
}
});
</script>
</head>
<body class="claro">
<div data-dojo-type="dijit/layout/BorderContainer" data-dojo-props="design:'headline', gutters:false" style="width:100%;height:100%;">
<div id="detailPane" data-dojo-type="dijit/layout/ContentPane" data-dojo-props="region:'top'">
Click a field to display the attribute inspector with customized fields.
</div>
<div data-dojo-type="dijit/layout/ContentPane" data-dojo-props="region:'center'" id="mapDiv"></div>
</div>
</body>
</html>
Solved! Go to Solution.
Accepted Solutions
- Mark as New
- Bookmark
- Subscribe
- Mute
- Subscribe to RSS Feed
- Permalink
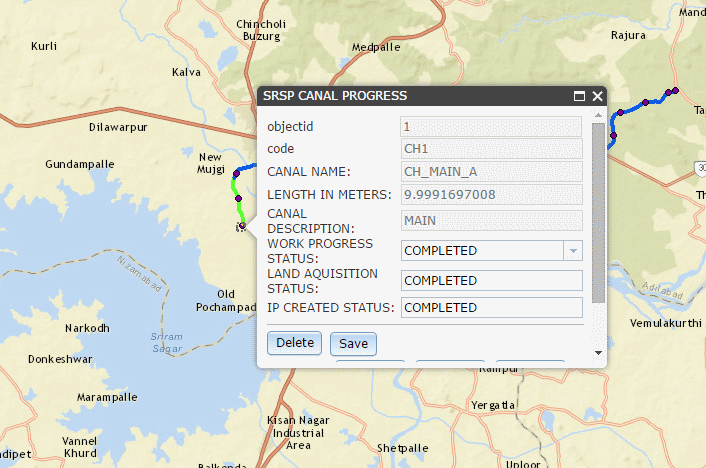
I've just added the circle buffer to your code - then when you click a point, the inspector opens:
<!DOCTYPE html>
<html>
<head>
<meta http-equiv="Content-Type" content="text/html; charset=utf-8">
<!--The viewport meta tag is used to improve the presentation and behavior of the samples
on iOS devices-->
<meta name="viewport" content="initial-scale=1, maximum-scale=1,user-scalable=no">
<title>Editable FeatureLayer in Selection Only Mode with Attribute Inspector</title>
<link rel="stylesheet" href="http://js.arcgis.com/3.14/dijit/themes/claro/claro.css">
<link rel="stylesheet" href="http://js.arcgis.com/3.14/esri/css/esri.css">
<style>
html, body {
height: 100%; width: 100%;
margin: 0;
padding: 0;
overflow: hidden;
}
#mapDiv{
margin: 0;
padding:0;
}
#detailPane{
height:20px;
color:#570026;
font-size:12pt;
font-weight:600;
overflow:hidden;
}
.dj_ie .infowindow .window .top .right .user .content { position: relative; }
.dj_ie .simpleInfoWindow .content {position: relative;}
.esriAttributeInspector {height:100px;}
.esriAttributeInspector .atiLayerName {display:none;}
.esriAttributeInspector .atiButton{
margin-top:1px;
margin-right:45px;
}
</style>
<script src="http://js.arcgis.com/3.14/"></script>
<script>
var map;
var updateFeature;
require([
"esri/map",
"esri/layers/FeatureLayer",
"esri/dijit/AttributeInspector",
"esri/symbols/SimpleLineSymbol",
"esri/symbols/SimpleFillSymbol",
"esri/Color",
"esri/layers/ArcGISDynamicMapServiceLayer",
"esri/config",
"esri/tasks/query",
"dojo/query",
"dojo/parser",
"dojo/dom-construct",
"dijit/form/Button",
"esri/graphic",
"esri/geometry/Circle",
"dijit/layout/BorderContainer", "dijit/layout/ContentPane", "dojo/domReady!"
], function(
Map, FeatureLayer, AttributeInspector,
SimpleLineSymbol, SimpleFillSymbol, Color,
ArcGISDynamicMapServiceLayer, esriConfig,
Query,dojoQuery,
parser, domConstruct, Button, Graphic, Circle
) {
parser.parse();
// refer to "Using the Proxy Page" for more information: https://developers.arcgis.com/javascript/jshelp/ags_proxy.html
// esriConfig.defaults.io.proxyUrl = "/proxy/";
map = new Map("mapDiv", {
basemap: "streets",
center: [78.20, 19.00],
zoom: 11
});
map.on("layers-add-result", initSelectToolbar);
var petroFieldsMSL = new ArcGISDynamicMapServiceLayer("http://gisserver.cgg.gov.in/arcgis/rest/services/IRR/srsp_canal_WRK1/MapServer");
petroFieldsMSL.setDisableClientCaching(true);
map.addLayer(petroFieldsMSL);
var petroFieldsFL = new FeatureLayer("http://gisserver.cgg.gov.in/arcgis/rest/services/IRR/srsp_canal_WRK1/FeatureServer/1", {
mode: FeatureLayer.MODE_SELECTION,
outFields: ["objectid","code", "codename", "length", "description", "status_work", "la_status", "ip_status"]
});
var selectionSymbol = new SimpleFillSymbol(
SimpleFillSymbol.STYLE_NULL,
new SimpleLineSymbol(
"solid",
new Color("yellow"),
2
),
null
);
petroFieldsFL.setSelectionSymbol(selectionSymbol);
var circleSymb = new SimpleFillSymbol(
SimpleFillSymbol.STYLE_NULL,
new SimpleLineSymbol(
SimpleLineSymbol.STYLE_SHORTDASHDOTDOT,
new Color([105, 105, 105]),
2
), new Color([255, 255, 0, 0.25])
);
var circle;
petroFieldsFL.on("edits-complete", function() {
petroFieldsMSL.refresh();
});
map.addLayers([petroFieldsFL]);
function initSelectToolbar(evt) {
//var petroFieldsFL = evt.layers[1].layer;
var selectQuery = new Query();
map.on("click", function(evt) {
circle = new Circle({
center: evt.mapPoint,
geodesic: true,
radius: 0.2,
radiusUnit: "esriMiles"
});
map.graphics.clear();
map.infoWindow.hide();
var graphic = new Graphic(circle, circleSymb);
map.graphics.add(graphic);
selectQuery.geometry =circle.getExtent();;
//selectQuery.geometry = evt.mapPoint;
petroFieldsFL.selectFeatures(selectQuery, FeatureLayer.SELECTION_NEW, function(features) {
if (features.length > 0) {
//store the current feature
updateFeature = features[0];
map.infoWindow.setTitle(features[0].getLayer().name);
map.infoWindow.show(evt.screenPoint, map.getInfoWindowAnchor(evt.screenPoint));
}
else {
map.infoWindow.hide();
}
});
});
map.infoWindow.on("hide", function() {
petroFieldsFL.clearSelection();
});
var layerInfos = [
{
'featureLayer': petroFieldsFL,
'showAttachments': false,
'isEditable': true,
'fieldInfos': [
{'fieldName': 'objectid', 'isEditable': false, 'objectid': 'objectid:'},
{'fieldName': 'code', 'isEditable': false, 'CANAL CODE': 'Acreage:'},
{'fieldName': 'codename', 'isEditable': false, 'label': 'CANAL NAME:'},
{'fieldName': 'length', 'isEditable': false, 'label': 'LENGTH IN METERS:'},
{'fieldName': 'description', 'isEditable': false, 'label': 'CANAL DESCRIPTION:'},
{'fieldName': 'status_work', 'isEditable': true, 'tooltip': 'WORK PROGRESS', 'label': 'WORK PROGRESS STATUS:'},
{'fieldName': 'la_status', 'isEditable': true, 'tooltip': 'LAND AQUISITION', 'label': 'LAND AQUISITION STATUS:'},
{'fieldName': 'ip_status', 'isEditable': true, 'tooltip': 'IP CREATED', 'label': 'IP CREATED STATUS:'}
]
}
];
var attInspector = new AttributeInspector({
layerInfos: layerInfos
}, domConstruct.create("div"));
//add a save button next to the delete button
var saveButton = new Button({ label: "Save", "class": "saveButton"},domConstruct.create("div"));
domConstruct.place(saveButton.domNode, attInspector.deleteBtn.domNode, "after");
saveButton.on("click", function() {
updateFeature.getLayer().applyEdits(null, [updateFeature], null);
});
attInspector.on("attribute-change", function(evt) {
//store the updates to apply when the save button is clicked
updateFeature.attributes[evt.fieldName] = evt.fieldValue;
});
attInspector.on("next", function(evt) {
updateFeature = evt.feature;
console.log("Next " + updateFeature.attributes.objectid);
});
attInspector.on("delete", function(evt) {
evt.feature.getLayer().applyEdits(null, null, [evt.feature]);
map.infoWindow.hide();
});
map.infoWindow.setContent(attInspector.domNode);
map.infoWindow.resize(350, 240);
}
});
</script>
</head>
<body class="claro">
<div data-dojo-type="dijit/layout/BorderContainer" data-dojo-props="design:'headline', gutters:false" style="width:100%;height:100%;">
<div id="detailPane" data-dojo-type="dijit/layout/ContentPane" data-dojo-props="region:'top'">
Click a field to display the attribute inspector with customized fields.
</div>
<div data-dojo-type="dijit/layout/ContentPane" data-dojo-props="region:'center'" id="mapDiv"></div>
</div>
</body>
</html>
- Mark as New
- Bookmark
- Subscribe
- Mute
- Subscribe to RSS Feed
- Permalink
Hi Narmala,
Try fiddling with the geometry in the query - the mapPoint is very distinct, so to return features from a mapPoint you would have to be very precis [read lucky] to hit a feature. If you create a buffer around your point, you will get much better results:
Select with Feature Layer | ArcGIS API for JavaScript
require ([
"esri/graphic",
"esri/geometry/Circle",
...
var circleSymb = new SimpleFillSymbol(
SimpleFillSymbol.STYLE_NULL,
new SimpleLineSymbol(
SimpleLineSymbol.STYLE_SHORTDASHDOTDOT,
new Color([105, 105, 105]),
2
), new Color([255, 255, 0, 0.25])
);
var circle;
....
function initSelectToolbar(evt) {
var petroFieldsFL = evt.layers[1].layer;
var selectQuery = new Query();
map.on("click", function(evt) {
circle = new Circle({
center: evt.mapPoint,
geodesic: true,
radius: 0.2,
radiusUnit: "esriMiles"
});
map.graphics.clear();
map.infoWindow.hide();
var graphic = new Graphic(circle, circleSymb);
map.graphics.add(graphic);
selectQuery.geometry = circle.getExtent();
....
- Mark as New
- Bookmark
- Subscribe
- Mute
- Subscribe to RSS Feed
- Permalink
Hi Herdis,
I am wondering how you get the info display.
I am not good in programming. can You help me in solving this.
Regards,
Satyanarayana
- Mark as New
- Bookmark
- Subscribe
- Mute
- Subscribe to RSS Feed
- Permalink
I've just added the circle buffer to your code - then when you click a point, the inspector opens:
<!DOCTYPE html>
<html>
<head>
<meta http-equiv="Content-Type" content="text/html; charset=utf-8">
<!--The viewport meta tag is used to improve the presentation and behavior of the samples
on iOS devices-->
<meta name="viewport" content="initial-scale=1, maximum-scale=1,user-scalable=no">
<title>Editable FeatureLayer in Selection Only Mode with Attribute Inspector</title>
<link rel="stylesheet" href="http://js.arcgis.com/3.14/dijit/themes/claro/claro.css">
<link rel="stylesheet" href="http://js.arcgis.com/3.14/esri/css/esri.css">
<style>
html, body {
height: 100%; width: 100%;
margin: 0;
padding: 0;
overflow: hidden;
}
#mapDiv{
margin: 0;
padding:0;
}
#detailPane{
height:20px;
color:#570026;
font-size:12pt;
font-weight:600;
overflow:hidden;
}
.dj_ie .infowindow .window .top .right .user .content { position: relative; }
.dj_ie .simpleInfoWindow .content {position: relative;}
.esriAttributeInspector {height:100px;}
.esriAttributeInspector .atiLayerName {display:none;}
.esriAttributeInspector .atiButton{
margin-top:1px;
margin-right:45px;
}
</style>
<script src="http://js.arcgis.com/3.14/"></script>
<script>
var map;
var updateFeature;
require([
"esri/map",
"esri/layers/FeatureLayer",
"esri/dijit/AttributeInspector",
"esri/symbols/SimpleLineSymbol",
"esri/symbols/SimpleFillSymbol",
"esri/Color",
"esri/layers/ArcGISDynamicMapServiceLayer",
"esri/config",
"esri/tasks/query",
"dojo/query",
"dojo/parser",
"dojo/dom-construct",
"dijit/form/Button",
"esri/graphic",
"esri/geometry/Circle",
"dijit/layout/BorderContainer", "dijit/layout/ContentPane", "dojo/domReady!"
], function(
Map, FeatureLayer, AttributeInspector,
SimpleLineSymbol, SimpleFillSymbol, Color,
ArcGISDynamicMapServiceLayer, esriConfig,
Query,dojoQuery,
parser, domConstruct, Button, Graphic, Circle
) {
parser.parse();
// refer to "Using the Proxy Page" for more information: https://developers.arcgis.com/javascript/jshelp/ags_proxy.html
// esriConfig.defaults.io.proxyUrl = "/proxy/";
map = new Map("mapDiv", {
basemap: "streets",
center: [78.20, 19.00],
zoom: 11
});
map.on("layers-add-result", initSelectToolbar);
var petroFieldsMSL = new ArcGISDynamicMapServiceLayer("http://gisserver.cgg.gov.in/arcgis/rest/services/IRR/srsp_canal_WRK1/MapServer");
petroFieldsMSL.setDisableClientCaching(true);
map.addLayer(petroFieldsMSL);
var petroFieldsFL = new FeatureLayer("http://gisserver.cgg.gov.in/arcgis/rest/services/IRR/srsp_canal_WRK1/FeatureServer/1", {
mode: FeatureLayer.MODE_SELECTION,
outFields: ["objectid","code", "codename", "length", "description", "status_work", "la_status", "ip_status"]
});
var selectionSymbol = new SimpleFillSymbol(
SimpleFillSymbol.STYLE_NULL,
new SimpleLineSymbol(
"solid",
new Color("yellow"),
2
),
null
);
petroFieldsFL.setSelectionSymbol(selectionSymbol);
var circleSymb = new SimpleFillSymbol(
SimpleFillSymbol.STYLE_NULL,
new SimpleLineSymbol(
SimpleLineSymbol.STYLE_SHORTDASHDOTDOT,
new Color([105, 105, 105]),
2
), new Color([255, 255, 0, 0.25])
);
var circle;
petroFieldsFL.on("edits-complete", function() {
petroFieldsMSL.refresh();
});
map.addLayers([petroFieldsFL]);
function initSelectToolbar(evt) {
//var petroFieldsFL = evt.layers[1].layer;
var selectQuery = new Query();
map.on("click", function(evt) {
circle = new Circle({
center: evt.mapPoint,
geodesic: true,
radius: 0.2,
radiusUnit: "esriMiles"
});
map.graphics.clear();
map.infoWindow.hide();
var graphic = new Graphic(circle, circleSymb);
map.graphics.add(graphic);
selectQuery.geometry =circle.getExtent();;
//selectQuery.geometry = evt.mapPoint;
petroFieldsFL.selectFeatures(selectQuery, FeatureLayer.SELECTION_NEW, function(features) {
if (features.length > 0) {
//store the current feature
updateFeature = features[0];
map.infoWindow.setTitle(features[0].getLayer().name);
map.infoWindow.show(evt.screenPoint, map.getInfoWindowAnchor(evt.screenPoint));
}
else {
map.infoWindow.hide();
}
});
});
map.infoWindow.on("hide", function() {
petroFieldsFL.clearSelection();
});
var layerInfos = [
{
'featureLayer': petroFieldsFL,
'showAttachments': false,
'isEditable': true,
'fieldInfos': [
{'fieldName': 'objectid', 'isEditable': false, 'objectid': 'objectid:'},
{'fieldName': 'code', 'isEditable': false, 'CANAL CODE': 'Acreage:'},
{'fieldName': 'codename', 'isEditable': false, 'label': 'CANAL NAME:'},
{'fieldName': 'length', 'isEditable': false, 'label': 'LENGTH IN METERS:'},
{'fieldName': 'description', 'isEditable': false, 'label': 'CANAL DESCRIPTION:'},
{'fieldName': 'status_work', 'isEditable': true, 'tooltip': 'WORK PROGRESS', 'label': 'WORK PROGRESS STATUS:'},
{'fieldName': 'la_status', 'isEditable': true, 'tooltip': 'LAND AQUISITION', 'label': 'LAND AQUISITION STATUS:'},
{'fieldName': 'ip_status', 'isEditable': true, 'tooltip': 'IP CREATED', 'label': 'IP CREATED STATUS:'}
]
}
];
var attInspector = new AttributeInspector({
layerInfos: layerInfos
}, domConstruct.create("div"));
//add a save button next to the delete button
var saveButton = new Button({ label: "Save", "class": "saveButton"},domConstruct.create("div"));
domConstruct.place(saveButton.domNode, attInspector.deleteBtn.domNode, "after");
saveButton.on("click", function() {
updateFeature.getLayer().applyEdits(null, [updateFeature], null);
});
attInspector.on("attribute-change", function(evt) {
//store the updates to apply when the save button is clicked
updateFeature.attributes[evt.fieldName] = evt.fieldValue;
});
attInspector.on("next", function(evt) {
updateFeature = evt.feature;
console.log("Next " + updateFeature.attributes.objectid);
});
attInspector.on("delete", function(evt) {
evt.feature.getLayer().applyEdits(null, null, [evt.feature]);
map.infoWindow.hide();
});
map.infoWindow.setContent(attInspector.domNode);
map.infoWindow.resize(350, 240);
}
});
</script>
</head>
<body class="claro">
<div data-dojo-type="dijit/layout/BorderContainer" data-dojo-props="design:'headline', gutters:false" style="width:100%;height:100%;">
<div id="detailPane" data-dojo-type="dijit/layout/ContentPane" data-dojo-props="region:'top'">
Click a field to display the attribute inspector with customized fields.
</div>
<div data-dojo-type="dijit/layout/ContentPane" data-dojo-props="region:'center'" id="mapDiv"></div>
</div>
</body>
</html>
- Mark as New
- Bookmark
- Subscribe
- Mute
- Subscribe to RSS Feed
- Permalink
Hi Herdis,
Thank you Very Much,
Regards,
Satyanarayana
- Mark as New
- Bookmark
- Subscribe
- Mute
- Subscribe to RSS Feed
- Permalink
hello herdis,
I am unable to get attribute inspector
its showing a error esri.layers.FeatureLayer: unable to find 'objectid' field in the layer 'fields' information [url: http://localhost:6080/arcgis/rest/services/editing/FeatureServer/1]
regards,
bharath
- Mark as New
- Bookmark
- Subscribe
- Mute
- Subscribe to RSS Feed
- Permalink
Hi Bharath,
I would make sure that the layer objectIdField of the featureLayer is in fact 'objectid'.
I can't see your url, it is on localhost. What happens if you use the layer that you posted earlier ("http://gisserver.cgg.gov.in/arcgis/rest/services/IRR/srsp_canal_WRK1/FeatureServer/1)? Here the objectIdField is 'objectid'. so that works on my side (I can edit it and save changes).
Kind regards Herdis
- Mark as New
- Bookmark
- Subscribe
- Mute
- Subscribe to RSS Feed
- Permalink
Hello,
I took that layer from arcgis service directory
- Mark as New
- Bookmark
- Subscribe
- Mute
- Subscribe to RSS Feed
- Permalink
OK. How about the layer that fails now, with missing objectid. Do you have a field called 'objectid' in that one?
- Mark as New
- Bookmark
- Subscribe
- Mute
- Subscribe to RSS Feed
- Permalink
Yes i have ms herdis