- Home
- :
- All Communities
- :
- Developers
- :
- JavaScript Maps SDK
- :
- JavaScript Maps SDK Questions
- :
- Re: ArcGIS JavaScript API: How to set default laye...
- Subscribe to RSS Feed
- Mark Topic as New
- Mark Topic as Read
- Float this Topic for Current User
- Bookmark
- Subscribe
- Mute
- Printer Friendly Page
ArcGIS JavaScript API: How to set default layer visibility using toggle check box and how to display selection information only for the visible layers?
- Mark as New
- Bookmark
- Subscribe
- Mute
- Subscribe to RSS Feed
- Permalink
Hi All,
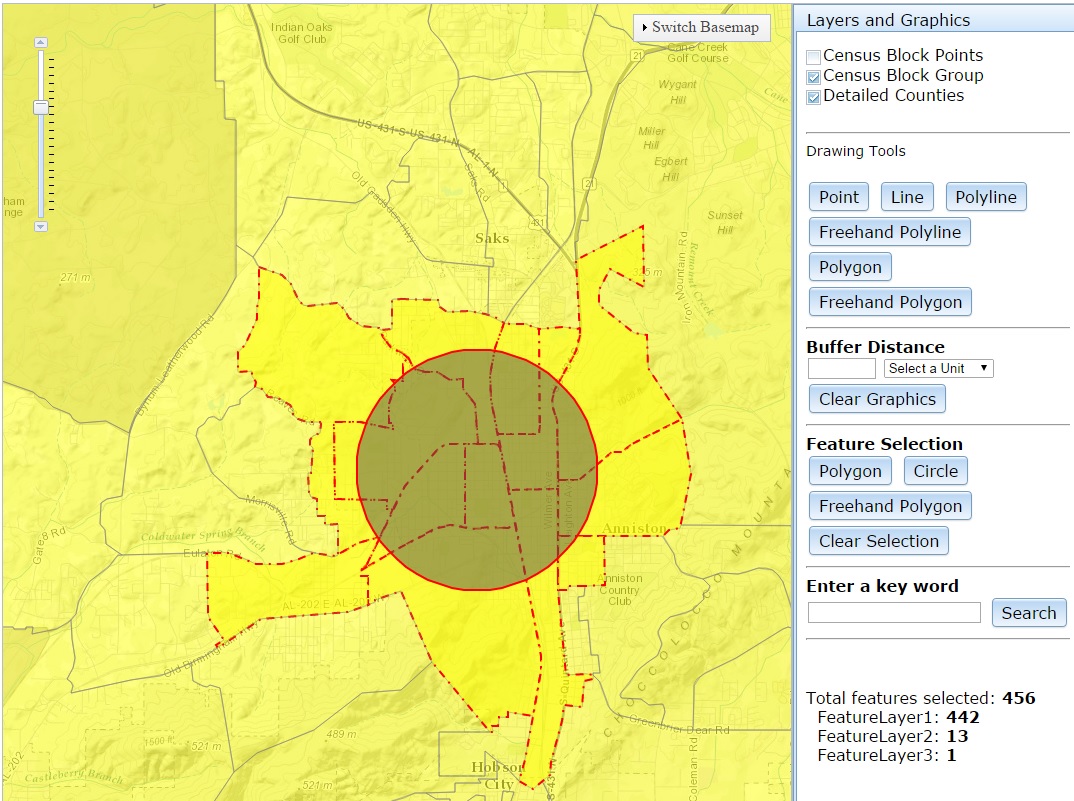
I have a web map similar to this example. I have two questions that need your help. First: When running the web map, it starts with all three layers checked and all three layers displayed on the map. How do I set it to start with featureLayer1 (Census Block Points) unchecked (Figure A) and only displays if the user checks it? Second: when I select features using one of the select features tools (Polygon, Circle and Freehand Polygon), all the selected features from the three layers are displayed on the map and the number of selected features from each layer including the total are displayed as text on the right pane (Figure B). This information displays even when I make selection with one or all of the features unchecked (and not displayed on the map) (Figure C). How do I display selection information only for the checked features?
Thanks.
Figure A: I want this to be my default starting page.
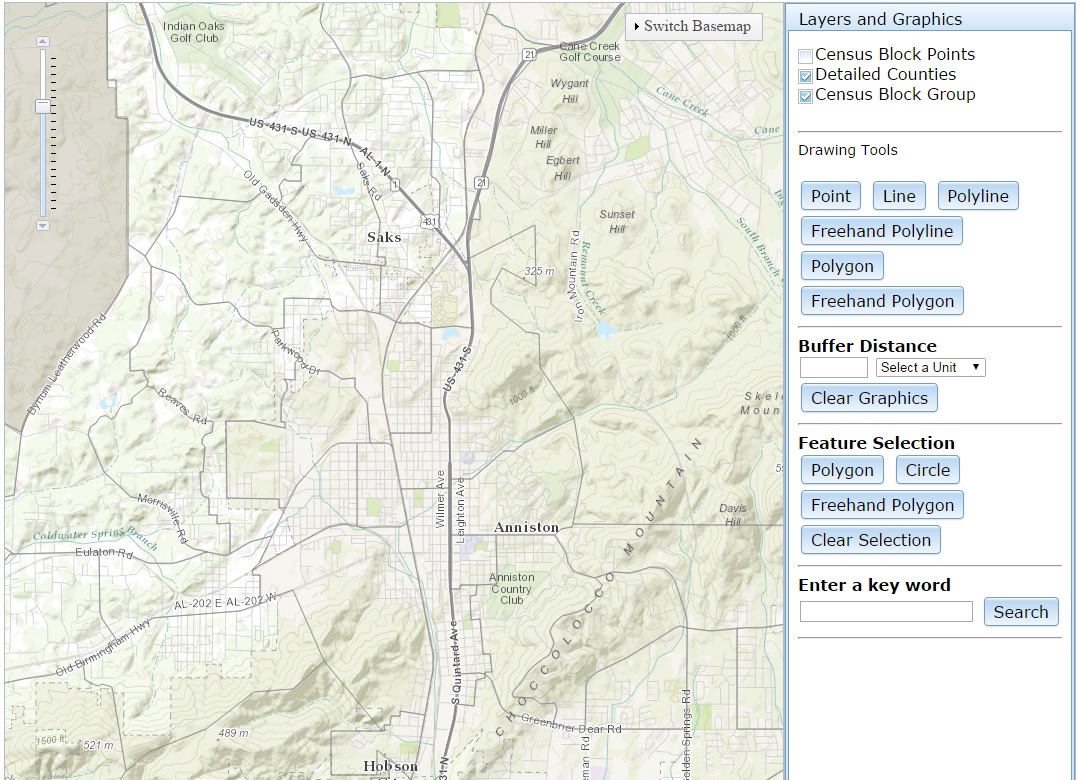
Figure B: This is when all layers checked.
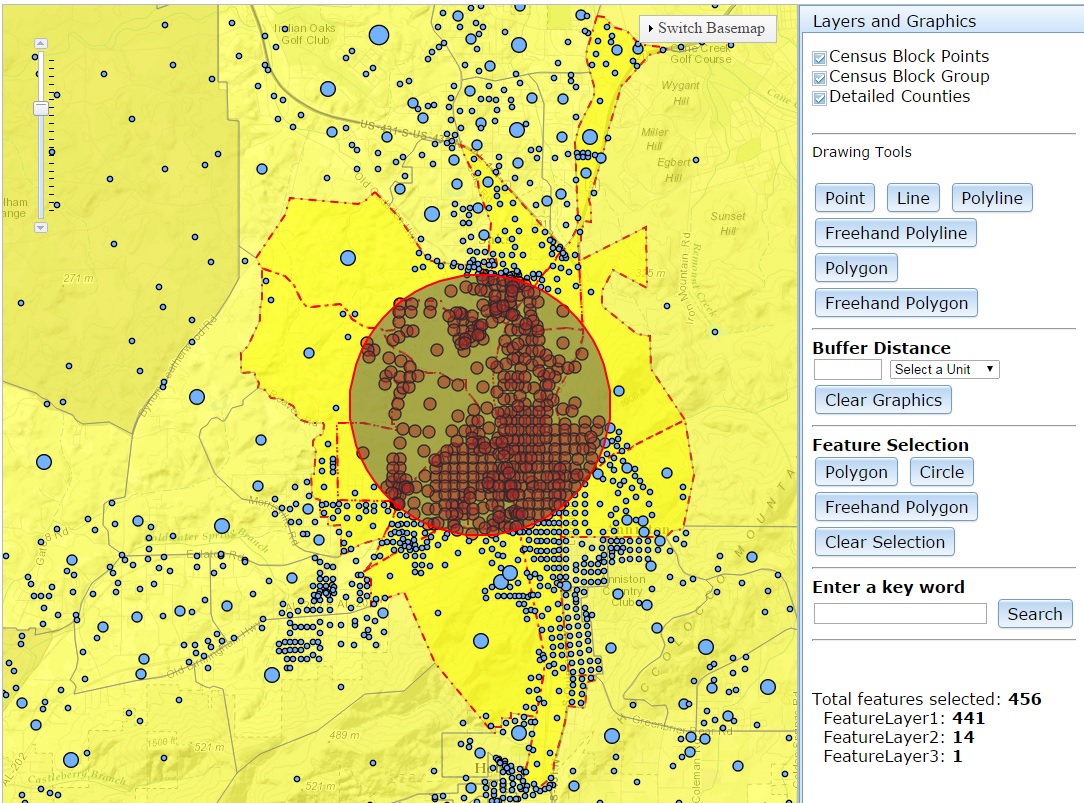
Figure C: This is when the top layer is unchecked so the Total features selected should be 14 and FeatureLayer1: should be 0
Solved! Go to Solution.
Accepted Solutions
- Mark as New
- Bookmark
- Subscribe
- Mute
- Subscribe to RSS Feed
- Permalink
Hab,
Here is an updated Fiddle that Does what Tim describes and does not spend time sending the selectFeatures query to the server if the layer is not visible.
- Mark as New
- Bookmark
- Subscribe
- Mute
- Subscribe to RSS Feed
- Permalink
To answer your first question, add the following code:
featureLayer1.setVisibility(false);
    var featureLayer1 = new FeatureLayer("http://sampleserver6.arcgisonline.com/arcgis/rest/services/Census/MapServer/0", {
        mode: FeatureLayer.MODE_ONDEMAND,
        infoTemplate: new InfoTemplate("Block: ${BLOCK}", "${*}"),
        outFields: ["POP2000", "HOUSEHOLDS", "HSE_UNITS", "TRACT", "BLOCK"]
    });
        featureLayer1.setSelectionSymbol(markerSymbol);
        featureLayer1.setVisibility(false);
        featureLayer1.on("selection-clear", function () {
        });
For your 2nd question, what if you put an if statement here:
        var featureLayer1Message = results[0].length;
        var featureLayer2Message = results[1].length;
        var featureLayer3Message = results[2].length;
i.e. if featurelayer 1 checkbox is checked run var featureLayer1Message = results[0].length;
Tim
- Mark as New
- Bookmark
- Subscribe
- Mute
- Subscribe to RSS Feed
- Permalink
Thanks Tim,
The answer to my first question works perfect. However, I'm a bit confused with the answer to my second question. Would you please show me how and where to put the if function?
Thanks
- Mark as New
- Bookmark
- Subscribe
- Mute
- Subscribe to RSS Feed
- Permalink
hello tim,
i found this code very useful,but in buffer parameters when i give distance 50 or 60 or 100 and draw the circle the radius is not changing can you please fix it.and secondly
--i want to use for loop, for featurelayers instead of featurelayer 1,featurelayer 2,featurelayer 3.(i have 30 layers) and please convert it in legacy module. thanks in advance tim.
the following code is running fine..
| <!DOCTYPE html> | |
| <html> | |
| <head> | |
| <meta http-equiv="Content-Type" content="text/html; charset=utf-8"> | |
| <meta name="viewport" content="initial-scale=1, maximum-scale=1,user-scalable=no"> | |
| <title>Select with feature layer</title> | |
| <link rel="stylesheet" href="http://js.arcgis.com/3.10/js/dojo/dijit/themes/claro/claro.css"> | |
| <link rel="stylesheet" href="http://js.arcgis.com/3.10/js/esri/css/esri.css"> | |
| <style> | |
| html, body, #mapDiv { | |
| padding:0; | |
| margin:0; | |
| height:100%; |
}
#rightPane {
| padding: 0; | |
| width:250px; |
}
#messages {
| padding-top: 40px; |
}
| </style> | |
| <script src="http://js.arcgis.com/3.10/"></script> | |
| <script> | |
| var map, gsvc, tb; |
require([
| "dojo/parser", "esri/map", "esri/toolbars/draw", "dojo/promise/all", | |
| "esri/symbols/SimpleMarkerSymbol", "esri/symbols/SimpleLineSymbol", "esri/symbols/SimpleFillSymbol", | |
| "esri/symbols/PictureFillSymbol", "esri/symbols/CartographicLineSymbol", "esri/layers/FeatureLayer", | |
| "esri/graphic", "esri/tasks/query", "esri/tasks/QueryTask", "esri/tasks/FindTask", "esri/tasks/FindParameters", "esri/InfoTemplate", | |
| "dojo/_base/array", "esri/dijit/Legend", "dijit/form/Button", "esri/layers/ArcGISDynamicMapServiceLayer", | |
| "esri/Color", "dojo/dom", "dojo/on", "esri/tasks/GeometryService", "esri/tasks/BufferParameters", | |
| "dijit/registry", "dojo/dom-construct", "dijit/form/CheckBox", "esri/geometry/screenUtils", "esri/graphicsUtils", | |
| "dijit/layout/BorderContainer", "dijit/layout/ContentPane", | |
| "dijit/layout/AccordionContainer", "dojo/domReady!"], function ( |
parser, Map, Draw, All,
SimpleMarkerSymbol, SimpleLineSymbol, SimpleFillSymbol,
PictureFillSymbol, CartographicLineSymbol, FeatureLayer,
Graphic, Query, QueryTask, FindTask, FindParameters, InfoTemplate,
arrayUtils, Legend, Button, ArcGISDynamicMapServiceLayer,
Color, dom, on, GeometryService, BufferParameters, registry,
domConstruct, CheckBox, screenUtils, graphicsUtils) {
| var findTask, findParms; |
| parser.parse(); |
| console.log(registry.byId("zoomin")); |
| registry.byId("search").on("click", doFind); |
| map = new Map("mapDiv", { | ||
| basemap: "streets", | ||
| center: [-85.82966, 33.666494], | ||
| zoom: 13 | ||
| }); | ||
| map.on("load", initToolbar); | ||
| var markerSymbol = new SimpleMarkerSymbol(); | ||
| markerSymbol.setStyle(SimpleMarkerSymbol.STYLE_CIRCLE); | ||
| markerSymbol.setSize(12); | ||
| markerSymbol.setColor(new Color([255,0,0,0.5])); | ||
| var fieldsSelectionSymbol = | ||
| new SimpleFillSymbol(SimpleFillSymbol.STYLE_SOLID, | ||
| new SimpleLineSymbol(SimpleLineSymbol.STYLE_DASHDOT, | ||
| new Color([255, 0, 0]), 1.5), new Color([255, 255, 0, 1.5])); |
| var featureLayer1 = new FeatureLayer("http://sampleserver6.arcgisonline.com/arcgis/rest/services/Census/MapServer/0", { | |
| mode: FeatureLayer.MODE_ONDEMAND, | |
| infoTemplate: new InfoTemplate("Block: ${BLOCK}", "${*}"), | |
| outFields: ["POP2000", "HOUSEHOLDS", "HSE_UNITS", "TRACT", "BLOCK"] | |
| }); | |
| featureLayer1.setSelectionSymbol(markerSymbol); | |
| featureLayer1.setVisibility(false); | |
| featureLayer1.on("selection-clear", function() { | |
| }); |
| var featureLayer2 = new FeatureLayer("http://sampleserver6.arcgisonline.com/arcgis/rest/services/Census/MapServer/1", { | |
| mode: FeatureLayer.MODE_ONDEMAND, | |
| infoTemplate: new InfoTemplate("Block Group: ${BLKGRP}", "${*}"), | |
| outFields: ["POP2000", "HOUSEHOLDS", "HSE_UNITS", "TRACT", "BLKGRP"] | |
| }); | |
| featureLayer2.setSelectionSymbol(markerSymbol); | |
| featureLayer2.setVisibility(false); | |
| featureLayer2.on("selection-clear", function() { | |
| }); |
| var featureLayer3 = new FeatureLayer("http://sampleserver6.arcgisonline.com/arcgis/rest/services/Census/MapServer/2", { | ||
| mode: FeatureLayer.MODE_ONDEMAND, | ||
| infoTemplate: new InfoTemplate("County Name: ${NAME}", "${*}"), | ||
| outFields: ["POP2000", "HOUSEHOLDS", "HSE_UNITS", "NAME"] | ||
| }); | ||
| featureLayer3.setSelectionSymbol(fieldsSelectionSymbol); | ||
| featureLayer3.setVisibility(false); | ||
| featureLayer3.on("selection-clear", function () { | ||
| }); | ||
| //add the legend | ||
| map.on("layers-add-result", function (evt) { | ||
| var layerInfo = arrayUtils.map(evt.layers, function (layer, index) { | ||
| return {layer:layer.layer, title:layer.layer.name}; | ||
| }); | ||
| if (layerInfo.length > 0) { | ||
| var legendDijit = new Legend({ | ||
| map: map, | ||
| layerInfos: layerInfo | ||
| }, "legendDiv"); | ||
| legendDijit.startup(); | ||
| } | ||
| //add check boxes | ||
| arrayUtils.forEach(layerInfo, function (layer) { | ||
| var layerName = layer.title; | ||
| if (layerName == undefined) { | ||
| layerName = "feature"; | ||
| } | ||
| var checkBox = new CheckBox({ | ||
| name: "checkBox" + layer.layer.id, | ||
| value: layer.layer.id, | ||
| checked: layer.layer.visible, | ||
| onChange: function (evt) { | ||
| var clayer = map.getLayer(this.value); | ||
| clayer.setVisibility(!clayer.visible); | ||
| this.checked = clayer.visible; | ||
| } | ||
| }); | ||
| //add the check box and label to the TOC | ||
| domConstruct.place(checkBox.domNode, "toggle", | ||
| "after"); | ||
| var checkLabel = domConstruct.create('label', { | ||
| 'for': checkBox.name, | ||
| innerHTML: layerName | ||
| }, checkBox.domNode, "after"); | ||
| domConstruct.place("<br/>", checkLabel, | ||
| "after"); | ||
| }); | ||
| }); |
| map.addLayers([featureLayer3, featureLayer2, featureLayer1]); | |
| // lineSymbol used for freehand polyline, polyline and line. | ||
| var lineSymbol = new CartographicLineSymbol( | ||
| CartographicLineSymbol.STYLE_SOLID, | ||
| new Color([255, 0, 0]), 10, | ||
| CartographicLineSymbol.CAP_ROUND, | ||
| CartographicLineSymbol.JOIN_MITER, 5); |
| // fill symbol used for extent, polygon and freehand polygon | |
| var fillSymbol = new SimpleFillSymbol(); |
| function initToolbar() { | |
| tb = new Draw(map); | |
| tb.on("draw-end", addGraphic); |
| // event delegation so a click handler is not | |
| // needed for each individual button | |
| on(dom.byId("info"), "click", function (evt) { | |
| if (evt.target.id === "info") { | |
| return; | |
| } | |
| var tool = evt.target.id.toLowerCase(); | |
| tb.activate(tool); | |
| }); | |
| } |
on(dom.byId("clearSelectionButton"), "click", function () {
| featureLayer1.clearSelection(); | |
| featureLayer2.clearSelection(); | |
| featureLayer3.clearSelection(); | |
| dom.byId("messages").innerHTML = "<a>No features selected</a>"; | |
| }); |
| function addGraphic(evt) { | ||
| //deactivate the toolbar and clear existing graphics | ||
| map.enableMapNavigation(); | ||
| tb.deactivate(); | ||
| // figure out which symbol to use | |
| var symbol; | |
| if (evt.geometry.type === "point" || evt.geometry.type === "multipoint") { | |
| symbol = markerSymbol; | |
| } else if (evt.geometry.type === "line" || evt.geometry.type === "polyline") { | |
| symbol = lineSymbol; | |
| } else { | |
| symbol = fillSymbol; | |
| } |
| map.graphics.add(new Graphic(evt.geometry, symbol)); | |
| queryMapService(evt.geometry); | |
| } |
| function queryMapService(Geom) { | |
| var promises = []; |
| var query = new Query(); | |
| query.returnGeometry = false; | |
| query.outFields = ["*"]; | |
| query.geometry = Geom; | |
| promises.push(featureLayer1.selectFeatures(query, FeatureLayer.SELECTION_NEW)); | |
| promises.push(featureLayer2.selectFeatures(query, FeatureLayer.SELECTION_NEW)); | |
| promises.push(featureLayer3.selectFeatures(query, FeatureLayer.SELECTION_NEW)); | |
| var allPromises = new All(promises); | |
| allPromises.then(function (r) { | |
| showResults(r); | |
| }); | |
| } |
| function showResults(results) { | |
| var featureLayer1Message = results[0].length; | |
| var featureLayer2Message = results[1].length; | |
| var featureLayer3Message = results[2].length; |
| var count = 0; | |
| for (var i = 0; i < results.length; i++) { | |
| count = count + results.length; | |
| } |
| dom.byId("messages").innerHTML = "Total features selected: <b>" + count + "</b><br> FeatureLayer1: <b>" + featureLayer1Message + "</b><br> FeatureLayer2: <b>" + featureLayer2Message + "</b><br> FeatureLayer3: " + featureLayer3Message; | ||
| } | ||
| //Create Find Task using the URL of the map service to search | ||
| findTask = new FindTask("http://sampleserver6.arcgisonline.com/arcgis/rest/services/Census/MapServer/"); | ||
| map.on("load", function () { | ||
| //Create the find parameters | ||
| findParams = new FindParameters(); | ||
| findParams.returnGeometry = true; | ||
| findParams.layerIds = [0, 1, 2]; | ||
| findParams.searchFields = ["POP2000", "HOUSEHOLDS", "HSE_UNITS", "NAME", "BLKGRP", "TRACT", "BLOCK"]; | ||
| findParams.outSpatialReference = map.spatialReference; | ||
| console.log("find sr: ", findParams.outSpatialReference); | ||
| }); | ||
| function doFind() { | ||
| //Set the search text to the value in the box | ||
| findParams.searchText = dom.byId("jobNumber").value; | ||
| findTask.execute(findParams, showfndResults); | ||
| } |
| function showfndResults(findresults) { | |
| //This function works with an array of FindResult that the task returns | |
| var markerSymbol = new SimpleMarkerSymbol(SimpleMarkerSymbol.STYLE_CIRCLE, 12, new SimpleLineSymbol(SimpleLineSymbol.STYLE_SOLID, new Color([255, 0, 0]), 1.5), new Color([255, 0, 0, 0.5])); | |
| var polygonSymbol = new SimpleFillSymbol(SimpleFillSymbol.STYLE_SOLID, new SimpleLineSymbol(SimpleLineSymbol.STYLE_SOLID, new Color([255, 0, 0]), 2), new Color([255, 0, 0, 0.5])); |
| //create array of attributes | |
| var items = arrayUtils.map(findresults, function (result) { | |
| var graphic = result.feature; | |
| if(graphic.geometry.type == 'point'){ | |
| graphic.setSymbol(markerSymbol);} | |
| else{graphic.setSymbol(polygonSymbol);} | |
| map.graphics.add(graphic); | |
| return result.feature; | |
| }); | |
| var myFeatureExtent = graphicsUtils.graphicsExtent(items); | |
| map.setExtent(myFeatureExtent, true); |
| } | ||
| gsvc = new GeometryService("http://tasks.arcgisonline.com/ArcGIS/rest/services/Geometry/GeometryServer"); | ||
| var params = new BufferParameters(); | ||
| params.distances = [ dom.byId("distance").value ]; | ||
| params.outSpatialReference = map.spatialReference; | ||
| params.unit = GeometryService[dom.byId("unit").value]; | ||
| if (geometry.type === "polygon") { | ||
| //if geometry is a polygon then simplify polygon. This will make the user drawn polygon topologically correct. | ||
| gsvc.simplify([geometry], function(geometries) { | ||
| params.geometries = geometries; | ||
| gsvc.buffer(params, showBuffer); | ||
| }); | ||
| } else { | ||
| params.geometries = [geometry]; | ||
| gsvc.buffer(params, showBuffer); | ||
| } | ||
| function showBuffer(bufferedGeometries) { | ||
| var symbol = new SimpleFillSymbol( | ||
| SimpleFillSymbol.STYLE_SOLID, | ||
| new SimpleLineSymbol( | ||
| SimpleLineSymbol.STYLE_SOLID, | ||
| new Color([255,0,0,0.65]), 2 | ||
| ), | ||
| new Color([255,0,0,0.35]) | ||
| ); | ||
| array.forEach(bufferedGeometries, function(geometry) { | ||
| var graphic = new Graphic(geometry, symbol); | ||
| map.graphics.add(graphic); | ||
| }); | ||
| tb.deactivate(); | ||
| map.showZoomSlider(); | ||
| } | ||
});
| </script> | ||||||||||||||||
| </head> | ||||||||||||||||
| <body class='claro'> | ||||||||||||||||
| <div id="mainWindow" data-dojo-type="dijit.layout.BorderContainer" data-dojo-props="design:'headline',gutters:false" style="width:100%; height:100%;"> | ||||||||||||||||
| <div id="mapDiv" class="shadow roundedCorners" data-dojo-type="dijit.layout.ContentPane" data-dojo-props="region:'center'"></div> | ||||||||||||||||
| <div data-dojo-type="dijit.layout.ContentPane" data-dojo-props="region:'right'" class="roundedCorners" id="rightPane"> | ||||||||||||||||
| <div data-dojo-type="dijit.layout.AccordionContainer"> | ||||||||||||||||
| <div data-dojo-type="dijit.layout.ContentPane" data-dojo-props="title:'Graphics'" id='graphics'> | ||||||||||||||||
| <div id="info"> | ||||||||||||||||
| <span style="padding: 10px 0;">Click to toggle each layer on or off</span> | ||||||||||||||||
| <div id="toggle" style="padding: 2px 2px;"></div> | ||||||||||||||||
| <br /><hr /> | ||||||||||||||||
| <div>Select a shape then draw on map to add graphic</div> | ||||||||||||||||
| <button id="Point">Point</button> | ||||||||||||||||
| <button id="Multipoint">Multipoint</button> | ||||||||||||||||
| <button id="Line">Line</button> | ||||||||||||||||
| <button id="Polyline">Polyline</button> | ||||||||||||||||
| <button id="FreehandPolyline">Freehand Polyline</button> | ||||||||||||||||
| <button id="Extent">Rectangle</button> | ||||||||||||||||
| <button id="Circle">Circle</button> | ||||||||||||||||
| <button id="Polygon">Polygon</button> | ||||||||||||||||
| <button id="FreehandPolygon">Freehand Polygon</button> | ||||||||||||||||
| <button id="clearSelectionButton" data-dojo-type="dijit/form/Button">Clear Selection</button> | ||||||||||||||||
| <button data-dojo-type="dijit.form.Button" type="button" onclick="map.graphics.clear();">Clear Graphics</button> | ||||||||||||||||
| </div> | ||||||||||||||||
| <br /><hr /> | ||||||||||||||||
| <div><b>Buffer Parameters</b></div> | ||||||||||||||||
| Distance: <input type="text" id="distance" size="3" value="" /> | ||||||||||||||||
| <select id="unit" style="width:90px;"> | ||||||||||||||||
| <option value="UNIT_STATUTE_MILE">Miles</option> | ||||||||||||||||
| <option value="UNIT_FOOT">Feet</option> | ||||||||||||||||
| <option value="UNIT_KILOMETER">Kilometers</option> | ||||||||||||||||
| <option value="UNIT_METER">Meters</option> | ||||||||||||||||
| </select><br /> | ||||||||||||||||
| <br /><hr /> | ||||||||||||||||
| <div>Search features a using keyword</div> | ||||||||||||||||
| <input type="text" id="jobNumber" size="20" value=""/> | ||||||||||||||||
| <button id="search" data-dojo-type="dijit.form.Button" type="button" data-dojo-attach-point="button" >Search</button> | ||||||||||||||||
| <br /><hr /> | ||||||||||||||||
| <div id="messages"></div> | ||||||||||||||||
| </div> | ||||||||||||||||
| <div data-dojo-type="dijit/layout/ContentPane" id="legendPane" data-dojo-props="title:'Legend'"> | ||||||||||||||||
| <div id="legendDiv"></div> | ||||||||||||||||
| </div> | ||||||||||||||||
| </div> | ||||||||||||||||
| </div> | ||||||||||||||||
| </div> |
</body>
| </html> |
- Mark as New
- Bookmark
- Subscribe
- Mute
- Subscribe to RSS Feed
- Permalink
Hab,
Here is an updated Fiddle that Does what Tim describes and does not spend time sending the selectFeatures query to the server if the layer is not visible.
- Mark as New
- Bookmark
- Subscribe
- Mute
- Subscribe to RSS Feed
- Permalink
Thanks both Robert and Tim,
This works perfect.
- Mark as New
- Bookmark
- Subscribe
- Mute
- Subscribe to RSS Feed
- Permalink
this is very helpful for me thank you ,can you please convert it into legacy module and i have 30 feature layers and i want to loop 30 layers, thanks in advance robert.