- Home
- :
- All Communities
- :
- Products
- :
- ArcGIS Insights
- :
- ArcGIS Insights Questions
- :
- Superpose Diagram and Histogram in Card - Insights...
- Subscribe to RSS Feed
- Mark Topic as New
- Mark Topic as Read
- Float this Topic for Current User
- Bookmark
- Subscribe
- Mute
- Printer Friendly Page
Superpose Diagram and Histogram in Card - Insights for ArcGIS
- Mark as New
- Bookmark
- Subscribe
- Mute
- Subscribe to RSS Feed
- Permalink
Hi,
I'm working on Insights for ArcGIS 1.2 and i use financial data on a city in France.
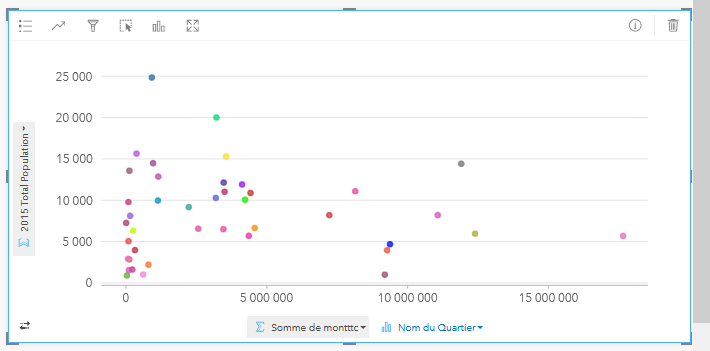
I want to create on the same Card, a graphic with an histogram respresenting Sum of spending by District / Diagramme representing Total Population by District.
When i choose 3 attributes to respresent on a card, the only thing i can do is a Scatter Plot...
Please fin on attached file results i obtainted and what i want obtain (screen shot from LindaBale Demo).
- Mark as New
- Bookmark
- Subscribe
- Mute
- Subscribe to RSS Feed
- Permalink
There is a step by step guide to creating a combochart here: Create charts—Insights web help Use tab | ArcGIS Enterprise
A combochart is a column chart and line graph combination and can be created using data from two different datasets, however, they must have a string field common to both datasets which is placed on the x axis. This chart then allows you to visualize two numbers for the same string category.
- Mark as New
- Bookmark
- Subscribe
- Mute
- Subscribe to RSS Feed
- Permalink
Thanks Linda for Help! 