- Home
- :
- All Communities
- :
- Products
- :
- ArcGIS Insights
- :
- ArcGIS Insights Questions
- :
- How do I configure values above columns in a colum...
- Subscribe to RSS Feed
- Mark Topic as New
- Mark Topic as Read
- Float this Topic for Current User
- Bookmark
- Subscribe
- Mute
- Printer Friendly Page
How do I configure values above columns in a column chart and a Multi-series chart?
- Mark as New
- Bookmark
- Subscribe
- Mute
- Subscribe to RSS Feed
- Permalink
A client ask me two questions:
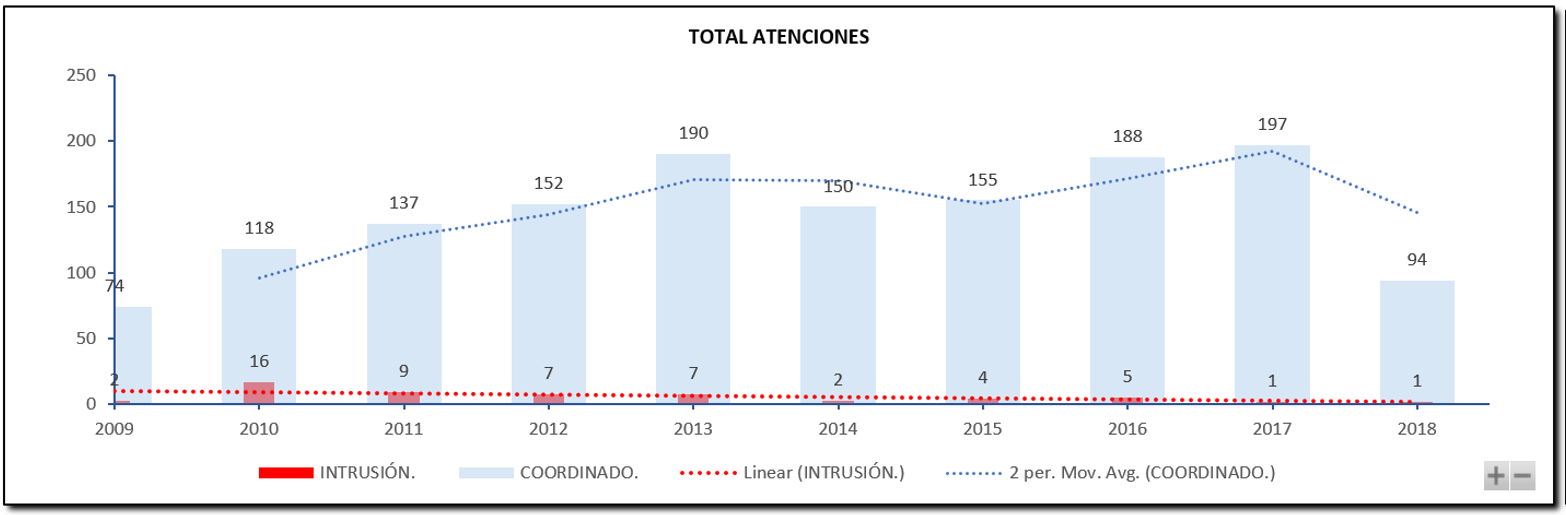
1. How can I configure values appear above the columns in a column chart?, and..
2. Can I make a Multi-series charts in Insights?
I cannot find the way to do this. Could you help me with this questions?
I attaching an image with the graphic that my client is trying to do in ArcGIS Insights.
Solved! Go to Solution.
Accepted Solutions
- Mark as New
- Bookmark
- Subscribe
- Mute
- Subscribe to RSS Feed
- Permalink
Hello Norah,
For question #1, we will be adding the ability to label bar/column/combo charts in our next release. This is planned for July.
For question #2, today we have the ability to display multiple time series on one chart by using the "group by" option. This works for data that is in the same table. In our July release we will support different datasets being displayed on the same time series chart.
Create and use a time series graph—Insights Create | Documentation