- Home
- :
- All Communities
- :
- Products
- :
- ArcGIS Hub
- :
- ArcGIS Hub Questions
- :
- Am I missing some critical documentation regarding...
- Subscribe to RSS Feed
- Mark Topic as New
- Mark Topic as Read
- Float this Topic for Current User
- Bookmark
- Subscribe
- Mute
- Printer Friendly Page
Am I missing some critical documentation regarding the "Design Layout" tab?
- Mark as New
- Bookmark
- Subscribe
- Mute
- Subscribe to RSS Feed
- Permalink
Apart from discussion forums, this is the only documentation on how to set up Open Data sites: Prepare Your Data—ArcGIS Open Data | ArcGIS
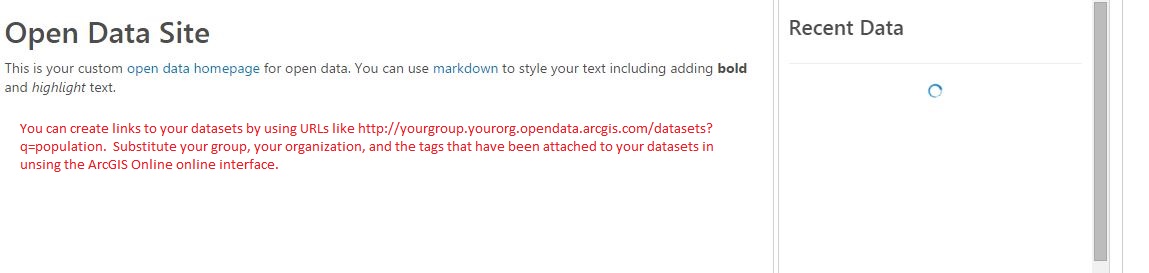
I've successfully accomplished everything from "Prepare Your Data" to "Data Report". The next step on this help page, "Design the layout of your open data site" is where my attempts at self-education hit a big stubborn wall. We are wanting to group our data like the MD group has: . http://imap.maryland.opendata.arcgis.com/ I imagine this is possible buy creating an "image widget" with a link to some content on our Open Data "Home Page", but how do I create the actual page where all of the datasets will be listed and previewable, such as this: http://imap.maryland.opendata.arcgis.com/datasets?q=Agriculture ? I tried creating a "data listing" widget, but all I get is this.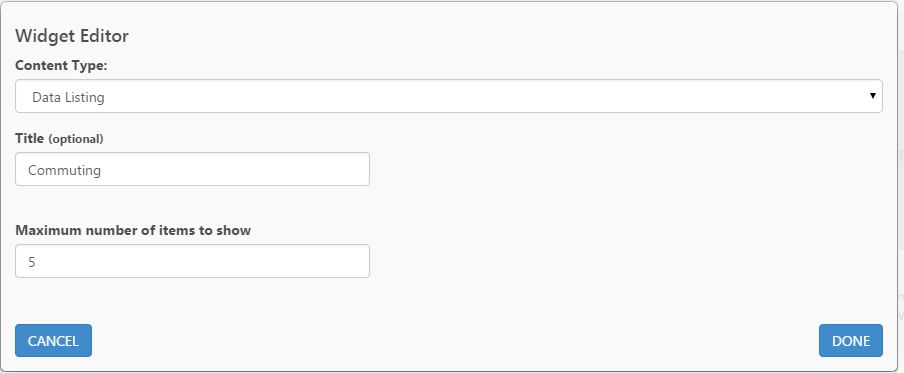
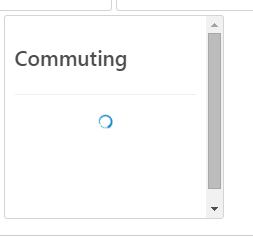
I would like to create a Commuting listing that will provide links to our commuting datasets that we uploaded to ArcGIS.com months ago. When I hit done, all I get is a widget with a endlessly spinning circle:
Please not that I have uncovered bug a when trying to create a "dataset map" widget. An ESRI technical support staffer wrote this when he could not help me create a dataset map:
As per our discussion and the observed behaviour, we have logged a bug with ID 000086559 for endlessly spinning wheel while configuring the Open Data homepage for Open Data site. I hope the issue will be taken care of soon.
This makes me think that there's a similar bug with the "dataset listing" widget. But let's say that these bugs didn't exist, is there any documentation about what to do with these widgets? Is there any type of "walk through" that helps Open Data providers create an open data portal like this: Home | the GIS Data Catalog ? Or is there a major functionality outage with the "Design Layout tab" that is preventing me from accessing intuitive tools about how to continue towards configuring my page to make it function like the Maryland page?
Thanks.
Solved! Go to Solution.
Accepted Solutions
- Mark as New
- Bookmark
- Subscribe
- Mute
- Subscribe to RSS Feed
- Permalink
Further, you will only receive results with datasets tagged "commuting" when using the keyword search as follows:
site.org.opendata.arcgis.com/datasets?keyword=commuting
When using the query search, you'll receive results with datasets that "commuting" in the tag, title, or description:
site.org.opendata.arcgis.com/datasets?q=commuting
Using the ?keyword search will give you more control over what is returned in the results.
- Mark as New
- Bookmark
- Subscribe
- Mute
- Subscribe to RSS Feed
- Permalink
Hi Alex,
The data listing widget will show the most recently modified datasets. Unfortunately it is not possible to set specific datasets to appear in this widget. If you preview your site you will see the dataset listing widget working. The problem with the dataset map widget is a known bug.
To have a category for your Commuting data, you can use the image widget (or include an image within the text widget) and add a hyperlink to a search query. Make sure all your Commuting data has a "Commuting" tag (edit in ArcGIS Online), and then they should all appear when you search "Commuting" in the search bar of your site. Copy that search query from your URL into your editor so the image links to the query.
We're working on some short instructional videos to outline processes like this.
Does that make sense?
Courtney
- Mark as New
- Bookmark
- Subscribe
- Mute
- Subscribe to RSS Feed
- Permalink
Further, you will only receive results with datasets tagged "commuting" when using the keyword search as follows:
site.org.opendata.arcgis.com/datasets?keyword=commuting
When using the query search, you'll receive results with datasets that "commuting" in the tag, title, or description:
site.org.opendata.arcgis.com/datasets?q=commuting
Using the ?keyword search will give you more control over what is returned in the results.
- Mark as New
- Bookmark
- Subscribe
- Mute
- Subscribe to RSS Feed
- Permalink
Thanks for your response. The critical step that I was missing was to preview the site and then start searching for keywords/tags. Now everything is making sense and we can probably proceed with setting up our open data site. I was under the impression that I was going to have to add data listing widget or a dataset map widget for any of our datasets to be visible to website users. In other words, I thought that I had to build the interface (add widgets) for our users to use. So I never thought to try the 'preview site' because I didn't think there would be anything to preview (beyond the banner images, placeholder images, etc that are very intuitive to set up).
I would suggest that ESRI staff add something to the documentation that shows people how to discover the URLs that will access their datasets (e.g., http://mygroup.myorg.opendata.arcgis.com/datasets?q=population&sort_by=relevance). I think the best spot would be between the "Data Report" section and "Design the Layout of your Open Data Site" section, or near the top of the latter. Maybe something like:
"You do not have to add widgets or modify HTML, CSS, Markdown for people to discover data on your site. To understand this, click the 'Preview Site' button and then search for a tag that you've attached to one of your datasets. The URL in browser bar on the search results page should be used as a template to create links to your data in the Design Layout tab"
Or is it already in your documentation and have I overlooked it? I do think videos would be helpful, but I think that somehow working this into the documentation is more important, especially if your weeks away from publishing the videos.
Using MarkDown, CSS, image links, etc will be easy now that I know which URLs to use when laying out the site.
- Mark as New
- Bookmark
- Subscribe
- Mute
- Subscribe to RSS Feed
- Permalink
Another way that you may want to use to educate Open Data first-timers is to add something like the text below to the Design Layout tab. I would have been able to start working on our site immediately if I had seen something to this effect:
- Mark as New
- Bookmark
- Subscribe
- Mute
- Subscribe to RSS Feed
- Permalink
Thanks Alex! I think this indeed would be really helpful for the documentation. I'll add a section for grouping datasets and it will be included in our next doc release in a couple weeks.
- Mark as New
- Bookmark
- Subscribe
- Mute
- Subscribe to RSS Feed
- Permalink
Thanks for listening. I do think some guidance on grouping would be helpful, but I think that explaining how to query for datasets via a sample URLs is the critical piece of information that is missing. I imagine that most Open Data providers have enough basic knowledge of HTML to start placing href links in their "home page". Those that don't have the MarkDown examples available to them. Now that I know how to link to pages like http://imap.maryland.opendata.arcgis.com/datasets?q=Agriculture and http://imap.maryland.opendata.arcgis.com/datasets/20f240af3be54be581f9ceef1b314b6a_0, everything else should fall into place for me. We'll likely reevaluate the tags that we've assigned to our AGO datasets that we intend to expose via our Open Data page. Most specifically, we'll make sure that the datasets that we want to group all have the same tag (such as the agriculture tag in the first link I pasted above).
- Mark as New
- Bookmark
- Subscribe
- Mute
- Subscribe to RSS Feed
- Permalink
Alex, you will need to change from using widgets to modifying the code. I suggest you create a new Open Data site and use it to test out different CSS styles and widget combinations and keep it private. When you find some code or widget that you like, you can then move that code to your public facing Open Data site.
Here is a good tutorial the Open Data guru's finally put together to help in creating some code for starters: #ProTip: Changing the page background color on your Open Data site
This should help get you started. As for creating the category page, it's all in the "tags"! For ours (Home | City of Phoenix Dev ) I made sure I put the related tag on each dataset (map service in our case) that would relate back to the category:

See where the URL references the "?keyword=political", that's the tag I put on the dataset. Then in the "Text Widget" I configured the following:

It's been a struggle customizing this Open Data site because you must know, CSS, HTML, Markdown and figures out Widgets! I have found our ESRI contacts to be extremely helpful !!!
Hope this helps!