Turn on suggestions
Auto-suggest helps you quickly narrow down your search results by suggesting possible matches as you type.
Cancel
- Home
- :
- All Communities
- :
- Products
- :
- ArcGIS GeoStatistical Analyst
- :
- ArcGIS GeoStatistical Analyst Questions
- :
- Re: questions about cross-validation
Options
- Subscribe to RSS Feed
- Mark Topic as New
- Mark Topic as Read
- Float this Topic for Current User
- Bookmark
- Subscribe
- Mute
- Printer Friendly Page
questions about cross-validation
Subscribe
5096
13
10-05-2011 09:50 AM
10-05-2011
09:50 AM
- Mark as New
- Bookmark
- Subscribe
- Mute
- Subscribe to RSS Feed
- Permalink
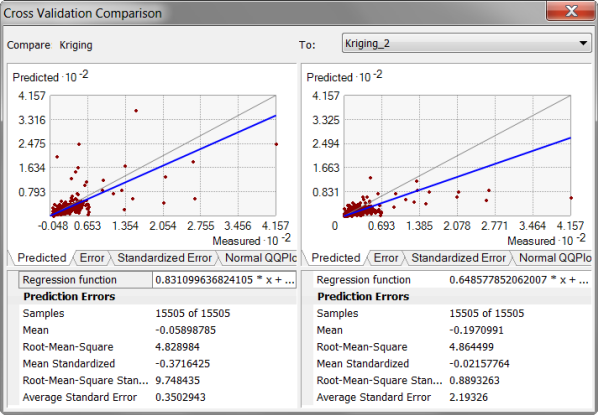
I have a question about the pic above.
Below is the original descriptions attached to this pic.
"For example, the root-mean-squared prediction error may be smaller for a particular model. Therefore, you might conclude that it is the optimal model. However, when comparing to another model, the root-mean-squared prediction error may be closer to the average estimated prediction standard error. This is a more valid model, because when you predict at a point without data, you have only the estimated standard errors to assess your uncertainty of that prediction. When the average estimated prediction standard errors are close to the root-mean-squared prediction errors from cross-validation, you can be confident that the prediction standard errors are appropriate. In the figure above, both kriging models are good, but those at the left are slightly better."
My question is, that, the ones with the root-mean-squared prediction errors closer to average standard errors should be the right one, instead of the left one. Why does it say that those at the left are slightly better? Thanks.
13 Replies
10-06-2011
06:41 AM
- Mark as New
- Bookmark
- Subscribe
- Mute
- Subscribe to RSS Feed
- Permalink
Good catch. I think this may be a typo in our help. I'll ask the author later today and get back to you.
If nothing else, we shouldn't be calling them both kriging models because the model on the right is from Local Polynomial Interpolation, which isn't a kriging model.
Thanks for the feedback.
If nothing else, we shouldn't be calling them both kriging models because the model on the right is from Local Polynomial Interpolation, which isn't a kriging model.
Thanks for the feedback.
10-06-2011
09:35 AM
- Mark as New
- Bookmark
- Subscribe
- Mute
- Subscribe to RSS Feed
- Permalink
Ok, we've talked it over, and we're going to change the graphic and some of the text from that topic. The 10.0 web help will update, and it will be changed in a future service pack as well as in version 10.1.
Thanks for bringing this to our attention.
Thanks for bringing this to our attention.
10-07-2011
07:34 AM
- Mark as New
- Bookmark
- Subscribe
- Mute
- Subscribe to RSS Feed
- Permalink
Ok, we've talked it over, and we're going to change the graphic and some of the text from that topic. The 10.0 web help will update, and it will be changed in a future service pack as well as in version 10.1.
Thanks for bringing this to our attention.
Thank you. So in addition to not being Kriging model on the right, according to the parameters in the cross-validatin, the one on the right should be better than the left one. Is that correct?
10-07-2011
08:57 AM
- Mark as New
- Bookmark
- Subscribe
- Mute
- Subscribe to RSS Feed
- Permalink
As for which is better, it's really a judgement call. Personally, I still like the model on the left because both the root-mean-square and average standard error are lower than the model on the right. A large difference between the RMS and the average standard error can indicate model problems, but a root-mean-square standardized of .85 indicates that the problem is not severe in this case. And the one point on the x-axis of the LPI model is also concerning.
When we change the graphic, we'll find an example where a lower RMS clearly does not imply a better model.
When we change the graphic, we'll find an example where a lower RMS clearly does not imply a better model.
09-06-2012
09:27 AM
- Mark as New
- Bookmark
- Subscribe
- Mute
- Subscribe to RSS Feed
- Permalink
Update:
The topic has been updated with a better example of when a lower RMS does not indicate a better model:
http://resources.arcgis.com/en/help/main/10.1/index.html#//0031000000q0000000
The topic has been updated with a better example of when a lower RMS does not indicate a better model:
http://resources.arcgis.com/en/help/main/10.1/index.html#//0031000000q0000000
09-27-2012
01:31 PM
- Mark as New
- Bookmark
- Subscribe
- Mute
- Subscribe to RSS Feed
- Permalink
As for which is better, it's really a judgement call. Personally, I still like the model on the left because both the root-mean-square and average standard error are lower than the model on the right. A large difference between the RMS and the average standard error can indicate model problems, but a root-mean-square standardized of .85 indicates that the problem is not severe in this case. And the one point on the x-axis of the LPI model is also concerning.
When we change the graphic, we'll find an example where a lower RMS clearly does not imply a better model.
Eric-
Is there a document that shows the various Prediction Error formulae (e.g., Mean Standardized Prediction Error, Root-Mean-Square Standardized, etc.), as implemented by ESRI?
I ask because different sources uses lightly different names for these metrics, and I know there can be subtle nuances to how they are calculated.
09-27-2012
03:06 PM
- Mark as New
- Bookmark
- Subscribe
- Mute
- Subscribe to RSS Feed
- Permalink
http://dusk.geo.orst.edu/gis/geostat_analyst.pdf
The formulas for the crossvalidation summary statistics can be found in Appendix A on page 273 (page 279 of the pdf, since the first six pages aren't numbered).
The formulas for the crossvalidation summary statistics can be found in Appendix A on page 273 (page 279 of the pdf, since the first six pages aren't numbered).
09-28-2012
05:02 AM
- Mark as New
- Bookmark
- Subscribe
- Mute
- Subscribe to RSS Feed
- Permalink
http://dusk.geo.orst.edu/gis/geostat_analyst.pdf
The formulas for the crossvalidation summary statistics can be found in Appendix A on page 273 (page 279 of the pdf, since the first six pages aren't numbered).
Perfect. Thanks Eric!
09-28-2012
09:19 AM
- Mark as New
- Bookmark
- Subscribe
- Mute
- Subscribe to RSS Feed
- Permalink
There's a typo in that pdf that I just noticed. For average standard error, the formula is missing a square. You can find the correct formulas here:
http://resources.arcgis.com/en/help/main/10.1/index.html#//00300000000z000000
"Average Standard Error" is the only formula that is different than you might expect. It might be better called "Root-Mean-Variance." We used this formula instead of a simple average because this formula is more directly comparable to the RMS.