- Home
- :
- All Communities
- :
- Products
- :
- ArcGIS Experience Builder
- :
- ArcGIS Experience Builder Questions
- :
- Re: Hello, I want to add multiple dashboards to Ex...
- Subscribe to RSS Feed
- Mark Topic as New
- Mark Topic as Read
- Float this Topic for Current User
- Bookmark
- Subscribe
- Mute
- Printer Friendly Page
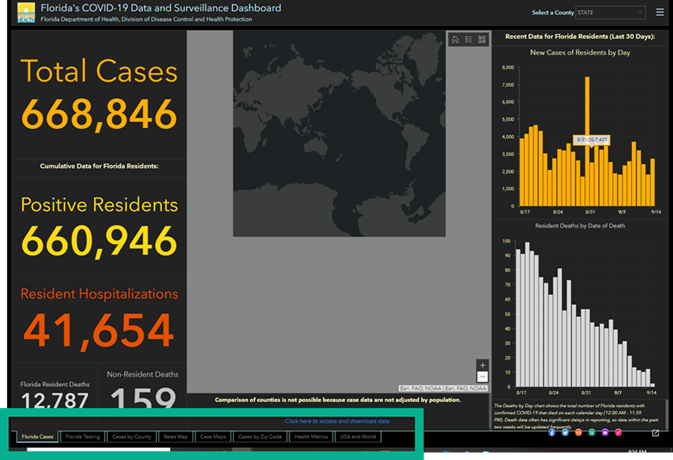
Hello, I want to add multiple dashboards to Experience and get the tabs as shown below, an example from a different dashboard. I have added two dashboards, one each to a page, so I have two pages. Where is the magic button in Experience to create the tab?
- Mark as New
- Bookmark
- Subscribe
- Mute
- Subscribe to RSS Feed
- Permalink
Solved! Go to Solution.
Accepted Solutions
- Mark as New
- Bookmark
- Subscribe
- Mute
- Subscribe to RSS Feed
- Permalink
Here is the answer I was looking for:
"You can do this through Experience Builder OR directly in Dashboards, by using the ‘Embedded Content’ widgets. Just add several ‘Embedded Content’ widgets, use the URL for each additional dashboard as the embedded content, and then use the ‘Move’ feature to drag each of the widgets on top of one another so that they stack. This will create the tabs at the bottom of the screen, which you can rename to whatever you’d like."
Thanks to Aaron Koelker for the answer.
- Mark as New
- Bookmark
- Subscribe
- Mute
- Subscribe to RSS Feed
- Permalink
Hi Janis,
The tab is coming from the dashboard. Here is the dashboard: ArcGIS Dashboards
Cheers,
David
- Mark as New
- Bookmark
- Subscribe
- Mute
- Subscribe to RSS Feed
- Permalink
Here is the answer I was looking for:
"You can do this through Experience Builder OR directly in Dashboards, by using the ‘Embedded Content’ widgets. Just add several ‘Embedded Content’ widgets, use the URL for each additional dashboard as the embedded content, and then use the ‘Move’ feature to drag each of the widgets on top of one another so that they stack. This will create the tabs at the bottom of the screen, which you can rename to whatever you’d like."
Thanks to Aaron Koelker for the answer.
- Mark as New
- Bookmark
- Subscribe
- Mute
- Subscribe to RSS Feed
- Permalink
Hi Janis,
Thank you for this but i have tried stacking multiple Embedded Content widgets and can't seem to make it work, they just end up sitting over the top of each other and they don't stack with tabs.
Was there any trick to getting them to stack?
- Mark as New
- Bookmark
- Subscribe
- Mute
- Subscribe to RSS Feed
- Permalink
To stack the dashboard tabs, like your example, and like one of my own ExpB
The work is done when creating the dashboard, and the trick is to create your dashboard, create a first then second element, then you grab one element and stack it by dragging to the centre of the other. You'll see the screen change and there will be a number of boxes appear, simply drop the one element over the centre.
When you have it in the right place the element to stack on will turn blue and you'll see "Stack Items".
This will give you the tabs.
- Mark as New
- Bookmark
- Subscribe
- Mute
- Subscribe to RSS Feed
- Permalink
Hi Jonathan,
Thank you for the quick reply!
I have been able to stack Dashboards in Dashboards but I can't stack Dashboards via the Embedded Content widget in Experience Builder. Using Experience Builder as the hosting container would allow more flexibility when dashboards don't need to be connected.
Can i just confirm the method you are referring to is relating to stacking in Dashboards?
- Mark as New
- Bookmark
- Subscribe
- Mute
- Subscribe to RSS Feed
- Permalink
Yes, stacking in Dashboards.
I now see what you're asking, if it's possible to stack multiple dashboards in Exp rather than seeing their stacked elements.
What you could do is create a section and each view within that section is a dashboard. The user could then "flip" through the pages to view those different dashboards.
I'd be wary of how long that may take to load as the viewer comes to the page.
I quickly threw this together; Sections and Dashboards
- Mark as New
- Bookmark
- Subscribe
- Mute
- Subscribe to RSS Feed
- Permalink
Thank you. I had tried the sections too but it's the tab layout that I really like. I have also looked at story maps but none of these other options work quiet as nice as the Dashboard Stacking method.
We have several related but quiet separate full screen dashboards, each dashboard is quiet heavy and can take a bit to load so they are better only loaded if selected. We are looking for a container to present a collection of dashboards. Experience builder seems to be the best fit but just trying to identify the easiest way to present the dashboards, ideally as tabs at the bottom.
Thank you so much for your time.
- Mark as New
- Bookmark
- Subscribe
- Mute
- Subscribe to RSS Feed
- Permalink
Fully appreciate the heavy full-screen dashboards, this dash Weather & River Sensors is fine for those with a big screen and can understand what is shown, however, I needed to open this up and make it more accessible, especially as our communities look at this data, hence translating it into experience builder as you've seen.
I suppose it all comes down to how you tell the story - as you've seen I've taken a few of the graphs and indicators and just created cards from the very same data
- Mark as New
- Bookmark
- Subscribe
- Mute
- Subscribe to RSS Feed
- Permalink
Fascinating! We are in similar spaces. Thank you for sharing thoese examples.
We have been using non-esri products for hydro graphs (see below) which need a little bit more data than what we can do in arcgis but your work makes me want to go back and revisit what we can do with portal.