- Home
- :
- All Communities
- :
- Products
- :
- ArcGIS Experience Builder
- :
- ArcGIS Experience Builder Questions
- :
- Experience Builder histogram not displaying correc...
- Subscribe to RSS Feed
- Mark Topic as New
- Mark Topic as Read
- Float this Topic for Current User
- Bookmark
- Subscribe
- Mute
- Printer Friendly Page
Experience Builder histogram not displaying correct distribution
- Mark as New
- Bookmark
- Subscribe
- Mute
- Subscribe to RSS Feed
- Permalink
Hi all -
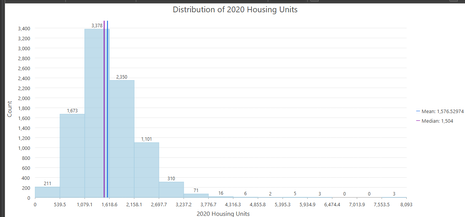
I am constructing a web app using Experience Builder. It includes a chart widget containing a histogram to display the distribution of a numerical field in the map's data (formatted as double). The histogram does not display the correct distribution for the underlying data:
The histogram only seems to include 2,000 records. The underlying data contains 9,129 records. This is what a correct histogram should look like:
Further, the chart widget does not update when the map extent changes. This behavior seems to be recent and does not happen with other charts (such as bar charts) using the chart widget. Any idea why the histogram in the chart widget is not displaying correctly?
Thanks!
- Mark as New
- Bookmark
- Subscribe
- Mute
- Subscribe to RSS Feed
- Permalink
Hi,
I am encountering the same issue as well. Were you able to figure it out?
I have noticed that this issue occurs only on a dashboard that has been created in an ArcGIS Enterprise setup and is not happening on a dashboard that has been created in a ArcGIS Online setup.
It does not appear that in the Enterprise setup, that the filtering parameters are being followed.
- Mark as New
- Bookmark
- Subscribe
- Mute
- Subscribe to RSS Feed
- Permalink
I have done some more testing.
Pulling in the same data from a different web map into the histogram chart ends up with the correct histogram displaying. It might be an issue with the original web map. I am working on checking to see if there are any differences between the web maps now.
- Mark as New
- Bookmark
- Subscribe
- Mute
- Subscribe to RSS Feed
- Permalink
Hi Nicolas -
Thanks for checking. I was concerned that a corrupted web layer was the problem so I constructed a new "Experience" using a completely new web layer and web map and it has the same problem with the histogram as my original visualization.
- Mark as New
- Bookmark
- Subscribe
- Mute
- Subscribe to RSS Feed
- Permalink
Hi Johnathan,
I did some additional testing. I removed the original web layer from the web map and save the web map. Then I added the same web layer back into the web map and saved it.
I was then able to go into the experience builder and build the histrogram again and the data displayed correctly.
Unfortunately, it messed up all the additional widgets that relied on the original web layer, as the added back in web layer does not seem to automatically recognized by the widgets as the original source.
Since there are half a dozen widgets that rely on the layer and I have a dozen layers that have histograms, I will not be using the histogram going forward for now. Hopefully, I can resolve this in the future. There is no guarantee that the issue will not come up again in the future.

