Turn on suggestions
Auto-suggest helps you quickly narrow down your search results by suggesting possible matches as you type.
Cancel
- Home
- :
- All Communities
- :
- Products
- :
- ArcGIS Enterprise
- :
- ArcGIS Enterprise Portal Questions
- :
- How to create a Thematic Map Layer from Excel Spre...
Options
- Subscribe to RSS Feed
- Mark Topic as New
- Mark Topic as Read
- Float this Topic for Current User
- Bookmark
- Subscribe
- Mute
- Printer Friendly Page
How to create a Thematic Map Layer from Excel Spreadsheets?
Subscribe
03-04-2012
03:27 PM
- Mark as New
- Bookmark
- Subscribe
- Mute
- Subscribe to RSS Feed
- Permalink
Hello, Firstly I might have posted this in a wrong thread and sorry if I did. I'm pretty new to ArcGis.
I've been asked to create a thematic map showing the surface runoff for a pre-defined rectangular domain. And I have data over Excel.
I have Lat. and Long. matrices (4 x 2079 each) for location and also a runoff data matrix with same size (each of them in an individual spreadsheet in a single Excel file).
I have to create a X-Y-Z map that should look like this (visually):
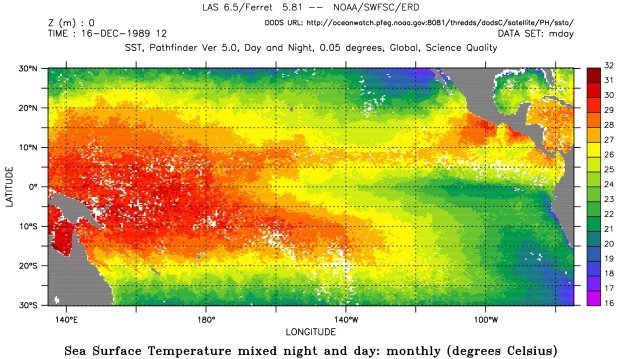
I would be faithful if someone can spare me the steps or necessary functions to create such a task. I'm aware that it's a very basic stuff, but I'm getting continuously lost on ArcGis with all those countless functions inside.
Thanks in advance.
I've been asked to create a thematic map showing the surface runoff for a pre-defined rectangular domain. And I have data over Excel.
I have Lat. and Long. matrices (4 x 2079 each) for location and also a runoff data matrix with same size (each of them in an individual spreadsheet in a single Excel file).
I have to create a X-Y-Z map that should look like this (visually):
I would be faithful if someone can spare me the steps or necessary functions to create such a task. I'm aware that it's a very basic stuff, but I'm getting continuously lost on ArcGis with all those countless functions inside.
Thanks in advance.
Solved! Go to Solution.
1 Solution
Accepted Solutions
03-05-2012
01:22 PM
- Mark as New
- Bookmark
- Subscribe
- Mute
- Subscribe to RSS Feed
- Permalink
I think the problem you had with the Point to raster tool failing is that it may not want to work from an XY event them as you had created but from an on-disk featureclass.
I was able to take that spreadsheet and make a raster from it. Use these steps using tools from in ArcGIS:
1) in ArcCatalog, right click on the XYZ worksheet and pick the "Create Featureclass, from XY Table" function. In this you can choose to set your Z value to the Runnoff field but that probably isn't necessary as the Runnoff field will become the cell value later on when you create the raster dataset. Make sure you select an appropriate coordinate system for your data; i chose WGS84 as i didn't know what else it might be, and the data seem to follow the coastline in that region fairly well.
2) Use the Feature class you just created as the input to the "Point to Raster" tool. This may take a little experimentation to get the result you're looking at and you'll want to try different settings for the Cell Assignment Type input and the Cellsize (see below) .
3)I left the Cell Assignment type at the default "Most Frequent" setting, but you might find for this sort of dataset that mean, min, or max might serve better depending on what you hope to demonstrate.
4) I used 0.05 as the cell size. The cell size is defined in terms of the extent of the dataset. I had tried accepting the default, and i got small cells centered on each point, with no data between them. A 2nd iteration at a cell size of .0335 did better but left bands of no data, and a 3rd and last test at 0.05 seems to have created a reasonable coverage. Since your data appear to be roughly on 4Km centers you might give .04 a try and see what that yields.
Once that data set is created you'll have a double precision raster storing values from -1 (those out in the Baltic Sea) to 3.4803 or so. I've attached a .pdf of the result so you can see how that turned out.
Let me know if this result works for you, i have some other thoughts about this, such as using interpolation methods rather than a straight point-to-raster methodology as well as whether or not you might want to project your data into a planar coordinate system first rather than working in a GCS system which makes specifying the cell size a little more challenging. There may also be other ways to get your data into a raster format depending on how it is organized before you put it into the 3 column format we're playing with here.
Good Luck!
Chris Thompson
5 Replies
03-05-2012
04:40 AM
- Mark as New
- Bookmark
- Subscribe
- Mute
- Subscribe to RSS Feed
- Permalink
Is it possible for you to post a sample of your data? it sounds like you have 2 types of datasets to work with: 1) a set of coordinates in a matrix that defines your study area and 2) the actual runnoff values you want to to map as 'z' values. Ultimately, to get the product you need you want to create a raster dataset.. there are probably a couple of different ways to approach that but understanding how your data are organized is the first step.
03-05-2012
10:53 AM
- Mark as New
- Bookmark
- Subscribe
- Mute
- Subscribe to RSS Feed
- Permalink
I thought about rearranging all the datasets into single columns for each, and guessed that would be more appropriate for Arcgis. For instance, I have 3 columns on a single Excel Spreadsheet;
Column A : Lat
Column B : Long
Column C : Runoff Data
I attached the file to this post.
I have tried Add XY data then point to raster, but Arcgis couldnt complete the "point to raster" task, it just said "error executing function"
Column A : Lat
Column B : Long
Column C : Runoff Data
I attached the file to this post.
I have tried Add XY data then point to raster, but Arcgis couldnt complete the "point to raster" task, it just said "error executing function"
03-05-2012
01:22 PM
- Mark as New
- Bookmark
- Subscribe
- Mute
- Subscribe to RSS Feed
- Permalink
I think the problem you had with the Point to raster tool failing is that it may not want to work from an XY event them as you had created but from an on-disk featureclass.
I was able to take that spreadsheet and make a raster from it. Use these steps using tools from in ArcGIS:
1) in ArcCatalog, right click on the XYZ worksheet and pick the "Create Featureclass, from XY Table" function. In this you can choose to set your Z value to the Runnoff field but that probably isn't necessary as the Runnoff field will become the cell value later on when you create the raster dataset. Make sure you select an appropriate coordinate system for your data; i chose WGS84 as i didn't know what else it might be, and the data seem to follow the coastline in that region fairly well.
2) Use the Feature class you just created as the input to the "Point to Raster" tool. This may take a little experimentation to get the result you're looking at and you'll want to try different settings for the Cell Assignment Type input and the Cellsize (see below) .
3)I left the Cell Assignment type at the default "Most Frequent" setting, but you might find for this sort of dataset that mean, min, or max might serve better depending on what you hope to demonstrate.
4) I used 0.05 as the cell size. The cell size is defined in terms of the extent of the dataset. I had tried accepting the default, and i got small cells centered on each point, with no data between them. A 2nd iteration at a cell size of .0335 did better but left bands of no data, and a 3rd and last test at 0.05 seems to have created a reasonable coverage. Since your data appear to be roughly on 4Km centers you might give .04 a try and see what that yields.
Once that data set is created you'll have a double precision raster storing values from -1 (those out in the Baltic Sea) to 3.4803 or so. I've attached a .pdf of the result so you can see how that turned out.
Let me know if this result works for you, i have some other thoughts about this, such as using interpolation methods rather than a straight point-to-raster methodology as well as whether or not you might want to project your data into a planar coordinate system first rather than working in a GCS system which makes specifying the cell size a little more challenging. There may also be other ways to get your data into a raster format depending on how it is organized before you put it into the 3 column format we're playing with here.
Good Luck!
Chris Thompson
I was able to take that spreadsheet and make a raster from it. Use these steps using tools from in ArcGIS:
1) in ArcCatalog, right click on the XYZ worksheet and pick the "Create Featureclass, from XY Table" function. In this you can choose to set your Z value to the Runnoff field but that probably isn't necessary as the Runnoff field will become the cell value later on when you create the raster dataset. Make sure you select an appropriate coordinate system for your data; i chose WGS84 as i didn't know what else it might be, and the data seem to follow the coastline in that region fairly well.
2) Use the Feature class you just created as the input to the "Point to Raster" tool. This may take a little experimentation to get the result you're looking at and you'll want to try different settings for the Cell Assignment Type input and the Cellsize (see below) .
3)I left the Cell Assignment type at the default "Most Frequent" setting, but you might find for this sort of dataset that mean, min, or max might serve better depending on what you hope to demonstrate.
4) I used 0.05 as the cell size. The cell size is defined in terms of the extent of the dataset. I had tried accepting the default, and i got small cells centered on each point, with no data between them. A 2nd iteration at a cell size of .0335 did better but left bands of no data, and a 3rd and last test at 0.05 seems to have created a reasonable coverage. Since your data appear to be roughly on 4Km centers you might give .04 a try and see what that yields.
Once that data set is created you'll have a double precision raster storing values from -1 (those out in the Baltic Sea) to 3.4803 or so. I've attached a .pdf of the result so you can see how that turned out.
Let me know if this result works for you, i have some other thoughts about this, such as using interpolation methods rather than a straight point-to-raster methodology as well as whether or not you might want to project your data into a planar coordinate system first rather than working in a GCS system which makes specifying the cell size a little more challenging. There may also be other ways to get your data into a raster format depending on how it is organized before you put it into the 3 column format we're playing with here.
Good Luck!
Chris Thompson
03-05-2012
11:41 PM
- Mark as New
- Bookmark
- Subscribe
- Mute
- Subscribe to RSS Feed
- Permalink
Thank you very very much - after a few attempts, I managed to generate the output.
07-16-2015
07:42 PM
- Mark as New
- Bookmark
- Subscribe
- Mute
- Subscribe to RSS Feed
- Permalink
I only know how to create data matrix in Excel. Thank you all for giving so many solutions on create a Thematic Map Layer from Excel Spreadsheets. Your works are of great help to me.