Turn on suggestions
Auto-suggest helps you quickly narrow down your search results by suggesting possible matches as you type.
Cancel
- Home
- :
- All Communities
- :
- Products
- :
- ArcGIS Dashboards
- :
- ArcGIS Dashboards Questions
- :
- Value of y-axis shows repetitive value
Options
- Subscribe to RSS Feed
- Mark Topic as New
- Mark Topic as Read
- Float this Topic for Current User
- Bookmark
- Subscribe
- Mute
- Printer Friendly Page
02-09-2020
12:43 PM
- Mark as New
- Bookmark
- Subscribe
- Mute
- Subscribe to RSS Feed
- Permalink
Hi there,
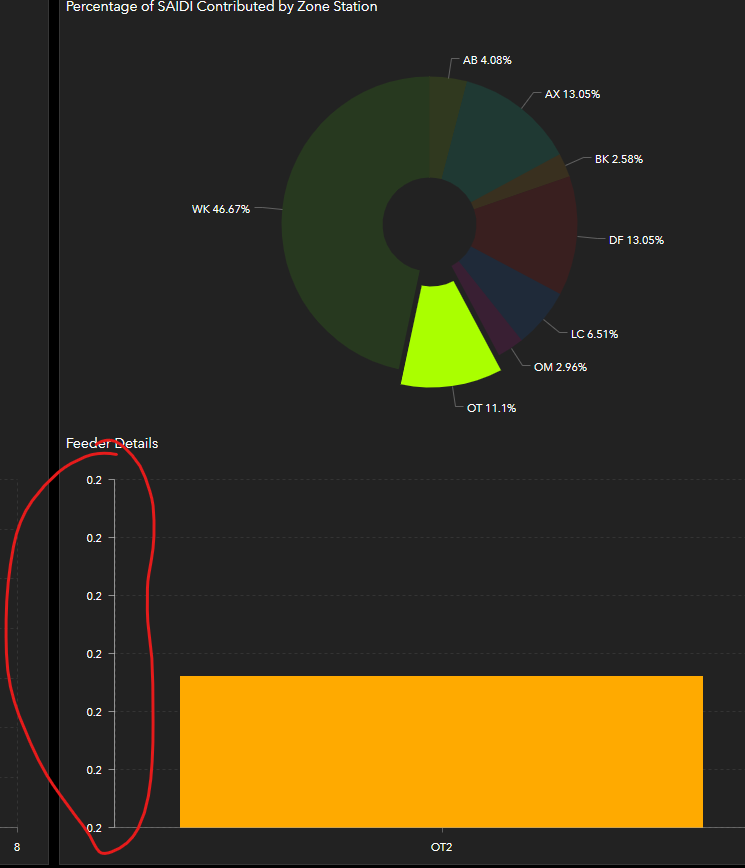
I am using serial chart on operation dashboard. There are few filters applied on the serial chart. I noticed that when samll value (typically between 0 and 1) shows on the serial chart, y-axis value repeats itself. For clarification, I have attached two pics that illustrates the issue.

Minimum and maximum value of axis is set on automatic.
Could you please help me in fixing the issue?
Solved! Go to Solution.
1 Solution
Accepted Solutions
02-09-2020
01:53 PM
- Mark as New
- Bookmark
- Subscribe
- Mute
- Subscribe to RSS Feed
- Permalink
looks like a decimal precision issue... can you not change the defaults or modify the formatting prefix by adding another # ie #,###.##
2 Replies
02-09-2020
01:53 PM
- Mark as New
- Bookmark
- Subscribe
- Mute
- Subscribe to RSS Feed
- Permalink
looks like a decimal precision issue... can you not change the defaults or modify the formatting prefix by adding another # ie #,###.##
02-09-2020
03:23 PM
- Mark as New
- Bookmark
- Subscribe
- Mute
- Subscribe to RSS Feed
- Permalink
Thanks. It worked.