- Home
- :
- All Communities
- :
- Products
- :
- ArcGIS Dashboards
- :
- ArcGIS Dashboards Questions
- :
- Summary Table in ArcGIS Online Dashboard?
- Subscribe to RSS Feed
- Mark Topic as New
- Mark Topic as Read
- Float this Topic for Current User
- Bookmark
- Subscribe
- Mute
- Printer Friendly Page
- Mark as New
- Bookmark
- Subscribe
- Mute
- Subscribe to RSS Feed
- Permalink
Hi all,
In short, I'd like to add a panel with a summary table in the ArcGIS Online Dashboard, but it does not appear that there is an option for that. Has anyone done something similar?
To get more in detail, I have a street centerline file where each street segment is coded with the type of on-street bicycle facility (bike lane, cycle track, bike boulevard, etc). The centerlines are also coded with the municipality the street is located in. I'd like to have a panel that summarizes the mileage of each bicycle facility by multiplicity. Ideally the user would select a municipality from a menu and the panel would then display the bike facility summary. If need be, I could configure a separate panel with a filter for each municipality, but I'd like to avoid setting up 30 different panels. Either way though, I do not see an option for adding a summary table in the Dashboard.
Solved! Go to Solution.
Accepted Solutions
- Mark as New
- Bookmark
- Subscribe
- Mute
- Subscribe to RSS Feed
- Permalink
Hi Dan,
> I'd like to add a panel with a summary table in the ArcGIS Online Dashboard
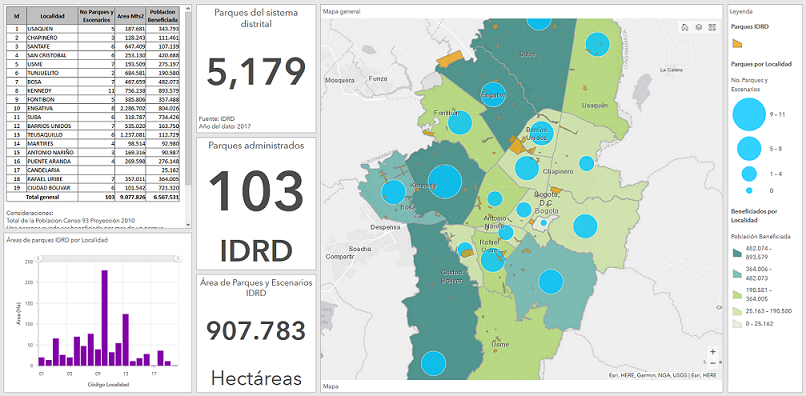
You can display a table in Ops Dashboard with the Embedded Content element, similar to this example:
City of Bogota - Park Management Dashboard
But I suspect this won't meet your needs, because you say:
> Ideally the user would select a municipality from a menu and the panel would then display the bike facility summary.
Which implies that you want some interactivity between the other Dashboard elements and the table. Ops Dashboard does not have an "attribute table" element at this time. Please vote for these enhancements,
Operations Dashboard: Attribute Table w/ CSV Export
Ability to display a table within a widget
Hope this helps,
- Mark as New
- Bookmark
- Subscribe
- Mute
- Subscribe to RSS Feed
- Permalink
Hi Dan,
> I'd like to add a panel with a summary table in the ArcGIS Online Dashboard
You can display a table in Ops Dashboard with the Embedded Content element, similar to this example:
City of Bogota - Park Management Dashboard
But I suspect this won't meet your needs, because you say:
> Ideally the user would select a municipality from a menu and the panel would then display the bike facility summary.
Which implies that you want some interactivity between the other Dashboard elements and the table. Ops Dashboard does not have an "attribute table" element at this time. Please vote for these enhancements,
Operations Dashboard: Attribute Table w/ CSV Export
Ability to display a table within a widget
Hope this helps,
- Mark as New
- Bookmark
- Subscribe
- Mute
- Subscribe to RSS Feed
- Permalink
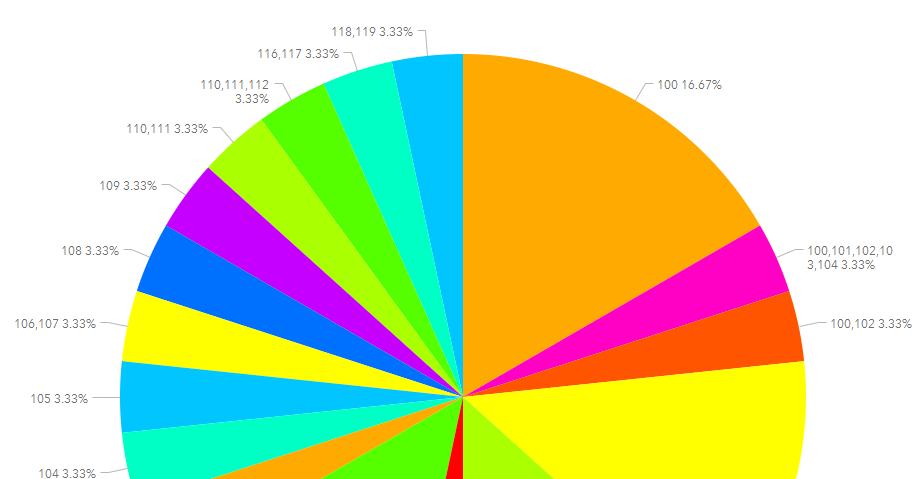
I am trying to do a similar table in a Dashboard. I have an inspection form in Survey123 that a fire inspector can fill out. Through Integromat, I have a PDF of the report created and uploaded to OneDrive. I also have a row populated in an Excel file in OneDrive. I had to do this, because Excel has better tools to summarize a "Select Multiple" question. For instance, they may perform more than one type of inspection at a single visit. I need that visit to count for 2 or 3 inspections. Select Multiple pie chart:
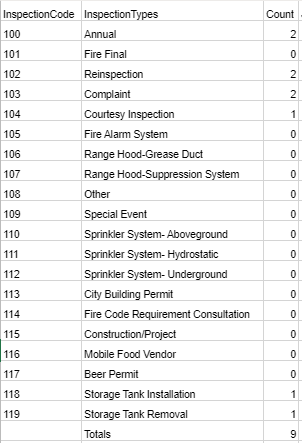
I set up the Excel file so I could summarize the data, but cannot figure out how to publish that Excel file to a hosted table to generate a pie chart in the Dashboard, or embed the Excel file/table in the Dashboard. Summary table that separates each inspection type (e.g. 101, 102, 103) into separate counts:
Is there a way to achieve what I'm wanting to do?
- Mark as New
- Bookmark
- Subscribe
- Mute
- Subscribe to RSS Feed
- Permalink
Hi Ben,
> I set up the Excel file so I could summarize the data, but cannot figure out how to publish that Excel file to a hosted table to generate a pie chart in the Dashboard, or embed the Excel file/table in the Dashboard.
Since the Excel table doesn't contain any location info, I don't think you can publish to ArcGIS Online as a hosted feature layer. I suppose you could publish the Excel table on a web page, then embed the web page into a Dashboard with the Embedded Content element.
Hope this helps,
- Mark as New
- Bookmark
- Subscribe
- Mute
- Subscribe to RSS Feed
- Permalink
Thanks. You are correct. It is an interactive table I am looking for. I voted for the enhancements.
- Mark as New
- Bookmark
- Subscribe
- Mute
- Subscribe to RSS Feed
- Permalink
UPDATE - Please review this blog,
Table: The newest visualization in ArcGIS Dashboards
Hope this helps,