- Home
- :
- All Communities
- :
- Products
- :
- ArcGIS Dashboards
- :
- ArcGIS Dashboards Questions
- :
- Operations Dashboard - Missing functions in MapToo...
- Subscribe to RSS Feed
- Mark Topic as New
- Mark Topic as Read
- Float this Topic for Current User
- Bookmark
- Subscribe
- Mute
- Printer Friendly Page
Operations Dashboard - Missing functions in MapTool Extensions based on JavaScript
- Mark as New
- Bookmark
- Subscribe
- Mute
- Subscribe to RSS Feed
- Permalink
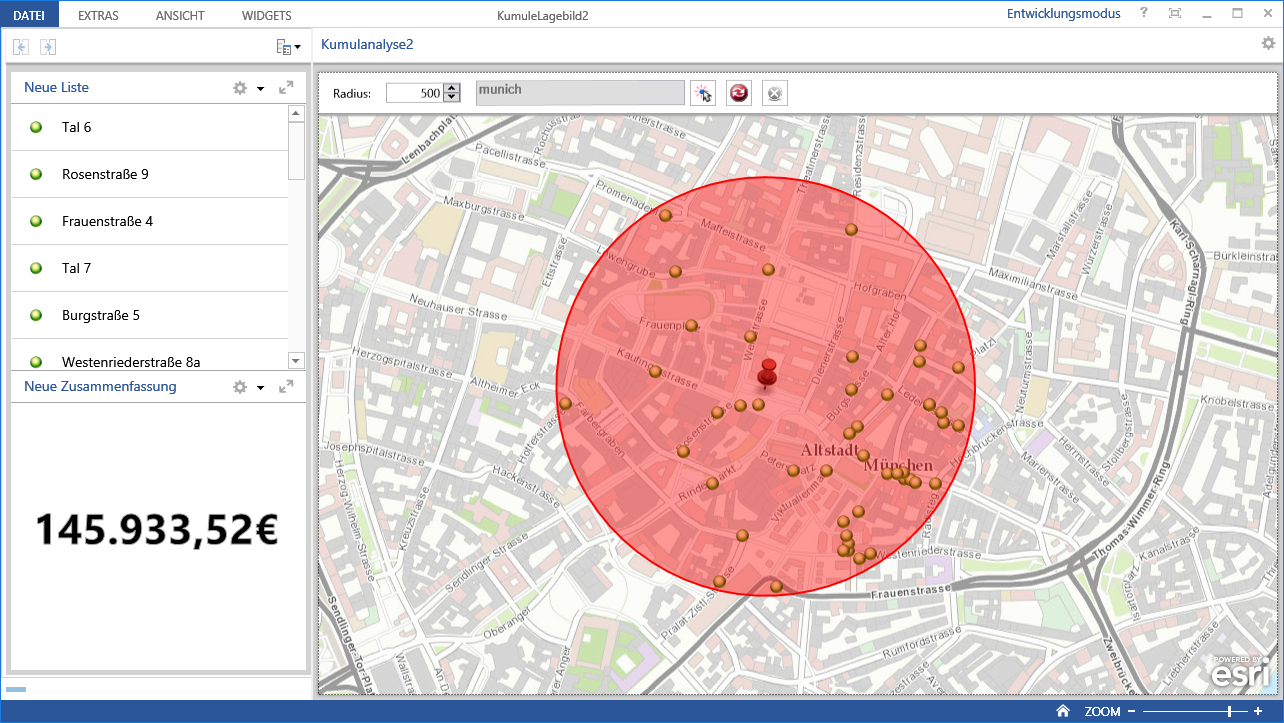
A while back, I have written a configurable MapTool in C#. This tool allows users to set a location in a map to visualize and analyze only the features within a buffer around it. Behind the scenes, a non-visible feature service of the webmap will be manipulated (where clause, visibility) to have the possibility to use the “original“ data source in the map or in widgets (list, summary, etc) instead of selections.
With JavaScript I am not able to do the same. I cannot (or I don't know how) :
- implement a datasource selector in the configuration,
- get the reference to the selected feature service or DataSourceProxies in the MapTool,
- manipulate the feature service (where clause, visibility), if I had the DataSourceProxy
Is there a way to do that with JavaScript? If not, are there any plans to provide such functions in a future release?
Another improvement suggestions:
- Because of only one map tool can be activated at a time, it would be nice to have the possibility to use the Find Places control (or other controls like layer filters or measure) in own MapTools.
- it would be nice to have feature actions on the result feature of Find Places (from here, to here etc)
- Dropdown lists in JS Maptools cannot overlap the map
Thanks,
Alex
- Mark as New
- Bookmark
- Subscribe
- Mute
- Subscribe to RSS Feed
- Permalink
Hey Alexander,
it looks like you want something like this: ArcGIS API for JavaScript Sandbox
As to what type of layer you want to query, you can just create an if statement that uses a certain layer to query depending on a dropdown box.
You could create an interface that will change variables in your query process. For example if your search radius should be 200, tie the variable to a text box. In this example it would look the following:
   circle = new Circle({
            center: evt.mapPoint,
            geodesic: true,
            radius: YourTextBoxValue, /// Your radius Value
            radiusUnit: "esriMiles" /// You can use a variable here as well to choose between Miles/Meters/Kilometers
          });
I did this in a JavaScript draw tool I have created, check out the example and code here: Advanced Draw
I hope this makes sense and is what you are asking 
Tim
- Mark as New
- Bookmark
- Subscribe
- Mute
- Subscribe to RSS Feed
- Permalink
Hi Tim,
Thank you for your answer, but I want to do that in a JavaScript MapTool Extension for Operations Dashboard 
Alex
- Mark as New
- Bookmark
- Subscribe
- Mute
- Subscribe to RSS Feed
- Permalink
Alexander,
thanks to you I have to learn this now . I'll let you know once I have figured it out!
Tim
- Mark as New
- Bookmark
- Subscribe
- Mute
- Subscribe to RSS Feed
- Permalink
i have the same issue like you , i searched a lot for a solution but in vain 
kindly if get some thing new , please inform me .
Thanks!
- Mark as New
- Bookmark
- Subscribe
- Mute
- Subscribe to RSS Feed
- Permalink
Hi Alex/Mahmoud ,
Thanks for your enhancement requests! Regarding your question about the map tool you’re trying to build, map tools don’t know the concept for data sources, as data sources are used to drive the widgets in an operation view. Map tools, on the other hand, deal with the map (e.g. show graphics, set extent). So the concept of data sources and map layers should be treated differently.
With that, I rephrased your use case a bit based on my understanding to it. Please let me know if my thinking is along the same direction as yours:
- In the configuration, implement a selector for the operation view publisher to choose a layer (not a data source).
- Get a reference (possibly the URL) to the selected layer in the map tool
- Manipulate the features of the layer by toggling the visibility of the features within the buffer.
If my understanding is correct, you should be able to achieve #2 and #3 with the existing API. Tim pointed us to a great sample that illustrates how to select the features within a given geometry, but if you want to display the actual symbols of the features as shown in your screenshot, you can try the following steps:
- Create a GraphicsLayerProxy up front (preferably in hostReady). It will be used to hold the graphics of the features to be shown on your map (i.e. mapWidgetProxy) (see this tutorial to learn more)
- Create the buffer and get its geometry (again you can take a look at the tutorial above to learn how to do so)
- Query for features:
- Create a QueryTask with the URL to your feature layer (captured from the configuration UI)
- Create a Query object, pass in the geometry of the buffer as a query parameter
- Do an QueryTask.execute(query) to get the features (i.e. Graphic objects) from the layer
- Pass in the features from the step above to GraphicsLayerProxy.addOrUpdateGraphics()
With the steps above, you should be able to get the features displayed on the map.
For #1, you need to know the URL to the target layer ahead (either by hardcoding it or capturing it from the config UI), and send it into your map tool. This is due to a limitation in our current API that the layer information of a map is not exposed.
Please let us know how it goes, and we'd love to hear from you again for other enhancement requests!
Tif
- Mark as New
- Bookmark
- Subscribe
- Mute
- Subscribe to RSS Feed
- Permalink
Hi Tif,
Thanks for your (late ) answer. In my case, the pure visualization of features within a graphicslayer would be just a part of the solution. After that I want to use the standard widgets (e.g. summary, lists, charts) to show some results based on the features inside of the buffer dynamically. Unfortunately this is not possible because the graphicslayers is not available as a data source in the other widgets.
The manipulation of the featureservice (where clause, visibility) was a good solution to do that in the maptool which I have created with the AG RT SDK 4 WPF.
Aside from this - I think you should provide the full functionality in all of the possibilities (Widgets, Tools, Feature Actions) to extent the Operations Dashboard with JavaScript. This gives developers more flexibility.
Alex
- Mark as New
- Bookmark
- Subscribe
- Mute
- Subscribe to RSS Feed
- Permalink
Hi again Alex,
Regarding your last question about "Dropdown lists in JS Maptools cannot overlap the map", the reason a dropdown cannot over the map is that each widget and map tool extension is actually running inside a webBrowser control (for the desktop app)/an iframe (for the browser app), so everything in the extension will be confined in their dedicated area.
For your use case, will it be possible to replace the dropdown with another type of control (e.g. some radio buttons?), or what about moving this setting to the configuration UI? Or if the above options are not acceptable, could you share a bit more why this is a must have feature for your extension so that I can submit the info along with this enhancement request?
Cheers,
Tif
- Mark as New
- Bookmark
- Subscribe
- Mute
- Subscribe to RSS Feed
- Permalink
Hi again Tif,
I tried to implement the JS API search widget in a map toolbar:
ArcGIS API for JavaScript | Basic Search
The suggestions are shown within a dropdown box
The use of the search widget is technical possible, but I was not able to visualize it in a good way. Therefore also the other improvement suggestion - the possibility to use the Operations Dashboard Find Places control (or other controls like layer filters or measure) in own MapToolbars.
Alex