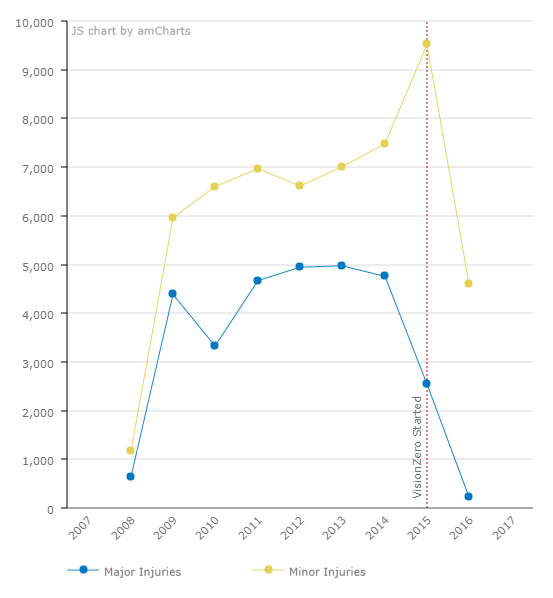
Hi,
I'm trying to assess the deference in capabilities between cedar charts and serial charts in operations dashboards. When using the grouped values option for a serial chart in an operations dashboard in AGOL/Portal:
Is it possible to carry out a statistical operation on more than one field and as a result have multiple series. Something like this which is a demo created using this query on cedar charts:

I don't seem to have the option to add more than one series unless I select 'features' in which case I don't seem to have the option to use statistics. Are the differences between cedar charts and the serial chart widget in operations dashboards documented anywhere?
Thanks