- Home
- :
- All Communities
- :
- Products
- :
- ArcGIS Dashboards
- :
- ArcGIS Dashboards Questions
- :
- How do i create this Indicator?
- Subscribe to RSS Feed
- Mark Topic as New
- Mark Topic as Read
- Float this Topic for Current User
- Bookmark
- Subscribe
- Mute
- Printer Friendly Page
- Mark as New
- Bookmark
- Subscribe
- Mute
- Subscribe to RSS Feed
- Permalink
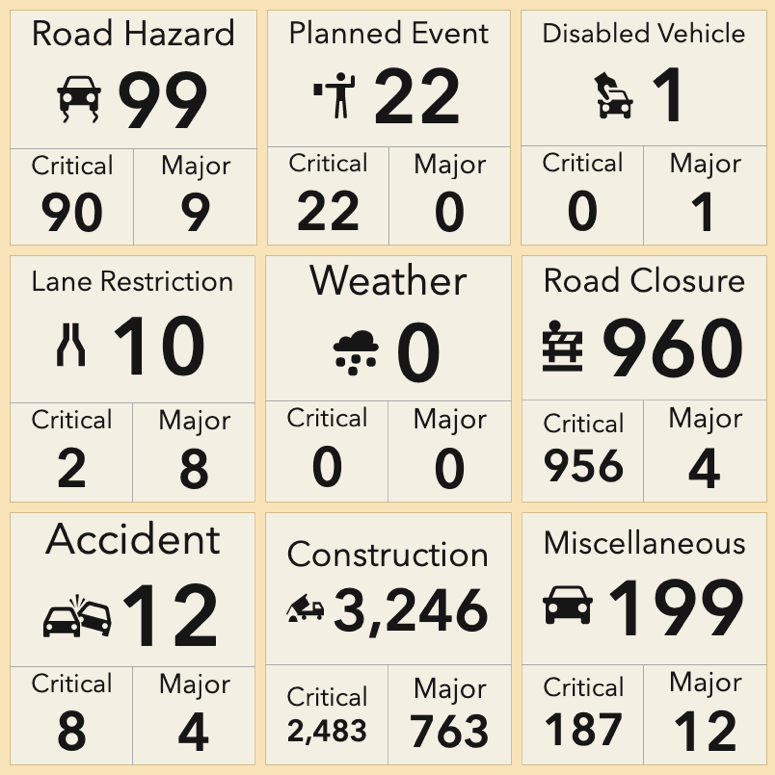
I was looking at this blog by David Nyenhuis (https://www.esri.com/arcgis-blog/products/ops-dashboard/decision-support/visualizing-data-effectivel...) and was after more information on how to create an Indicator like the example below. Here is the Operations Dashboard: https://www.arcgis.com/apps/opsdashboard/index.html#/73f32a5e74e748599c38124ba4337fbe.
Is it just a case of how you configure the Bottom Text? I haven't seen any border setting for an Indicator... Thanks!

Solved! Go to Solution.
Accepted Solutions
- Mark as New
- Bookmark
- Subscribe
- Mute
- Subscribe to RSS Feed
- Permalink
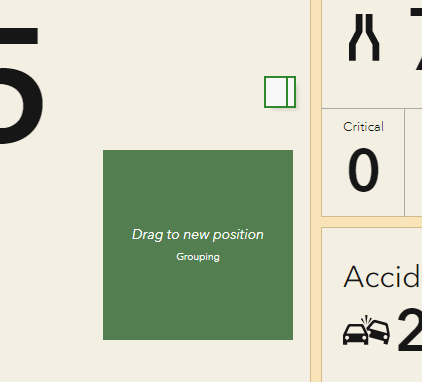
When dragging a widget, hold down the shift key, the docking icons will change to green and you can dock them more within each other like the dashboard you were looking at shows

- Mark as New
- Bookmark
- Subscribe
- Mute
- Subscribe to RSS Feed
- Permalink
When dragging a widget, hold down the shift key, the docking icons will change to green and you can dock them more within each other like the dashboard you were looking at shows

- Mark as New
- Bookmark
- Subscribe
- Mute
- Subscribe to RSS Feed
- Permalink
Perfect! Thanks for that.