- Home
- :
- All Communities
- :
- Products
- :
- ArcGIS Dashboards
- :
- ArcGIS Dashboards Questions
- :
- Re: Empty results from data expression in Dashboar...
- Subscribe to RSS Feed
- Mark Topic as New
- Mark Topic as Read
- Float this Topic for Current User
- Bookmark
- Subscribe
- Mute
- Printer Friendly Page
Empty results from data expression in Dashboard
- Mark as New
- Bookmark
- Subscribe
- Mute
- Subscribe to RSS Feed
- Permalink
Hello!
I am new to data expressions in dashboard. I want to combine two columns from one layer, by dividing them with each other, but my code gives me no results. I also get no error message, it is just empty.
If anyone has an idea what is wrong with my code I am grateful to hear. Thanks in advance.
/Elinor
var fs = FeatureSetByPortalItem(Portal('https://www.arcgis.com'),
'1db5c1db1d2d44a985b2a2144f6c663f', 0,
["M3SK_HA", "M3SK_HA_Lov"], false)
var percentLov = {
'fields': [{'name':'Lovpercent', 'type':'esriFieldTypeDouble'},
],
'geometryType': '',
'features':
[{'attributes':
{'Lovpercent': 'M3SK_HA_Lov'/'M3SK_HA'
}}]};
return FeatureSet(Text(percentLov));
Solved! Go to Solution.
Accepted Solutions
- Mark as New
- Bookmark
- Subscribe
- Mute
- Subscribe to RSS Feed
- Permalink
If you check out the function reference pages, the GroupBy function returns a FeatureSet, which is why it's a great workaround.
The thing with Data Expressions is that, yes, they need to use a FeatureSet, but when you define them yourself, you need to add every feature one by one. Defining the FeatureSet's features array as you have in your expression would leave you with a single feature.
Think of it like this:
features: [
    // feature 1
    { attributes: {
         attribute1: value,
         attribute2: value
    }},
    // feature 2
    { attributes: {
         attribute1: value,
         attribute2: value
    }},
    ... // and so on, for every feature in the layer
]
Manually defining each feature is not realistic, so most Data Expressions will use a for loop to iterate over the input features. If you wanted to go that route, you've got a bit more you'll need to add.
var fs = FeatureSetByPortalItem(
    Portal('https://www.arcgis.com'),
    '1db5c1db1d2d44a985b2a2144f6c663f', 0,
    ["M3SK_HA", "M3SK_HA_Lov"],
    false
)

var out_dict = {
    fields: [
        {name:'Lovpercent', type:'esriFieldTypeDouble'},
        {name:'M3SK_HA_Lov', type:'esriFieldTypeDouble'},
        {name:'M3SK_HA', type:'esriFieldTypeDouble'}
    ],
    geometryType: '',
    features: []
};

// Iterate over the fs FeatureSet
for (var f in fs){

    // calculate percentage
    var ha   = f['M3SK_HA']
    var ha_l = f['M3SK_HA_Lov']
    var p    = ha_l / ha

    // push values into feature array
    Push(
        out_dict['features'],
        {
            attributes: {
                Lovpercent: p,
                M3SK_HA_Lov: ha_l,
                M3SK_HA: ha
            }
        }
    )
}

return FeatureSet(Text(out_dict));
Kendall County GIS
- Mark as New
- Bookmark
- Subscribe
- Mute
- Subscribe to RSS Feed
- Permalink
The part of your expression "'M3SK_HA_Lov'/'M3SK_HA'" is the issue. Your expression is just taking those as literal strings, and it has no way of knowing that those correspond to fields in your FeatureSet. You'd need to tell your expression how it is to be accessing the attributes.
In order to correct this, can you clarify what the intended output is? Do you mean to "combine two columns" into a single statistic? The way it's written, your expression will have a single feature in it. And if that's the case, what you're trying to accomplish can be done more directly in other widgets.
If, however, you want to create a new field that has the dividend per feature, you'll need to use a loop to populate the features array. However! If your output FeatureSet is going to be the same shape as the input, you can actually do this in a much easier way.
var fs = FeatureSetByPortalItem(
    Portal('https://www.arcgis.com'),
    '1db5c1db1d2d44a985b2a2144f6c663f', 0,
    ["M3SK_HA", "M3SK_HA_Lov"],
    false
)

return GroupBy(
    fs,
    'OBJECTID', // or whatever unique ID field your layer has
    {
        name: 'Lovpercent',
        expression: 'M3SK_HA_Lov / M3SK_HA',
        statistic: 'SUM'
    }
)
The GroupBy function gives us the ability to create a new field using a SQL expression. By "grouping" the layer by its unique identifier, you'll get every row back out, and by "summing" the single values for each ID, you get the values themselves.
This would output the number, not text, but most Dashboard widgets can handle value formatting to make things look nice.
Speaking of which: what widget are you intending to use this with? If it's a widget that has access to Arcade-based formatting, you could calculate the dividend directly off of the source layer, no need for Data Expressions at all.
Kendall County GIS
- Mark as New
- Bookmark
- Subscribe
- Mute
- Subscribe to RSS Feed
- Permalink
Thank you very much for your super quick and information-rich answer. I will think about your questions, and I will be more specific telling what my intended output is, and I will answer tomorrow:)
- Mark as New
- Bookmark
- Subscribe
- Mute
- Subscribe to RSS Feed
- Permalink
Hello jcarlson! The intended output is to create a new field with that has the dividend per feature.
I don't own the data and so I cannot add a field directly in the table in the map viewer.
I intend to use the widget "Indicator". Maybe then I can calculate the dividend directly of the source layer, under Advanced formatting?
I am unsure about the question "If the output FeatureSet is going to be the same shape as the input", if by shape you mean same style of the data, the answer is yes 🙂
- Mark as New
- Bookmark
- Subscribe
- Mute
- Subscribe to RSS Feed
- Permalink
I guess it would have been more accurate to say "same length", since the columns would change and not actually be the same "shape".
In widgets that keep a feature-by-feature output like a List or a Table, Advanced Formatting would be more than enough for what you're doing.
The Indicator widget, though, is going to aggregate your data, unless of course you have it set to show an indcator per-feature. For instance, here's an Indicator of a "world cities" layer. I have the value set to a sum of "MALES", and the reference set to a sum of "POPULATION".
With my value and reference set, I can have the indicator set to "{percentage}". No advanced formatting or data expressions needed.

But this is a straightforward example. I'm not sure what your data looks like, but what statistic will you be trying to show? If I wanted something like the "average percentage" of the cities, this wouldn't cut it. In a normal distribution it'll be sort of close, but any outliers are going to skew things quite a bit.
Kendall County GIS
- Mark as New
- Bookmark
- Subscribe
- Mute
- Subscribe to RSS Feed
- Permalink
Hi! Thank you very much for your interesting answer, I learned a lot. Interesting to see how you use the percentage in the Indicator widget for aggregated version, I didn't know that was possible.
My aim is to calculate the division of M3SK_HA_Lov / M3SK_HA per feature and use that data for further calculation:
The end result I need to show is how big area-percentage of the total area of certain geography, has features that exceed 49 % in the M3SK_HA_Lov / M3SK_HA. Every feature has data describing AREA, M3SK_HA_Lov and M3SK_HA.
For example if 500 of 1500 features has 49 % or more in the division of M3SK_HA_Lov / M3SK_HA, and that would mean they have an area sum of 1000 hectares, and the remaining features (1500) has an area sum of 4000, the percentage output I'm looking for is 1000/4000 = 25%
The filtration of the geography I was planning to use Map-filtration inside the dashboard.
What widget would you recommend for this purpose?
- Mark as New
- Bookmark
- Subscribe
- Mute
- Subscribe to RSS Feed
- Permalink
Okay. That sounds like you will definitely need the Data Expression, then, since you're filtering individual features by that percentage. And you can still use an Indicator for the percentage.
Since we want to have the summed area of the > 49% features, we'll need to amend that original Data Expression to retain the area fields.
var fs = FeatureSetByPortalItem(
    Portal('https://www.arcgis.com'),
    '1db5c1db1d2d44a985b2a2144f6c663f', 0,
    ["M3SK_HA", "M3SK_HA_Lov"],
    false
)

return GroupBy(
    fs,
    'OBJECTID', // or whatever unique ID field your layer has
    [
        {
            name: 'Lovpercent',
            expression: 'M3SK_HA_Lov / M3SK_HA',
            statistic: 'SUM'
        },
        {
            name: 'M3SK_HA',
            expression: 'M3SK_HA',
            statistic: 'SUM'
        },
        {
            name: 'M3SK_HA_Lov',
            expression: 'M3SK_HA_Lov',
            statistic: 'SUM'
        }
    ]
)
Once you have that, you can apply a filter to your indicator to only include features where Lovpercent is 49% or greater.

Then configure the indicator to use the M3SK_HA_Lov attribute as the value and M3SK_HA as the reference value, both set to Statistic: Sum, and have the indicator show the percentage.
In order to filter the map, though, you'll need something else. Maybe a number selector?
Kendall County GIS
- Mark as New
- Bookmark
- Subscribe
- Mute
- Subscribe to RSS Feed
- Permalink
Thank you, wow, there are so many things one can do with these expressions! And thanks also for explaining how I could configure the indicator once the Data expression works 😇
Ok, Data expression is needed and Indicator for percentage.
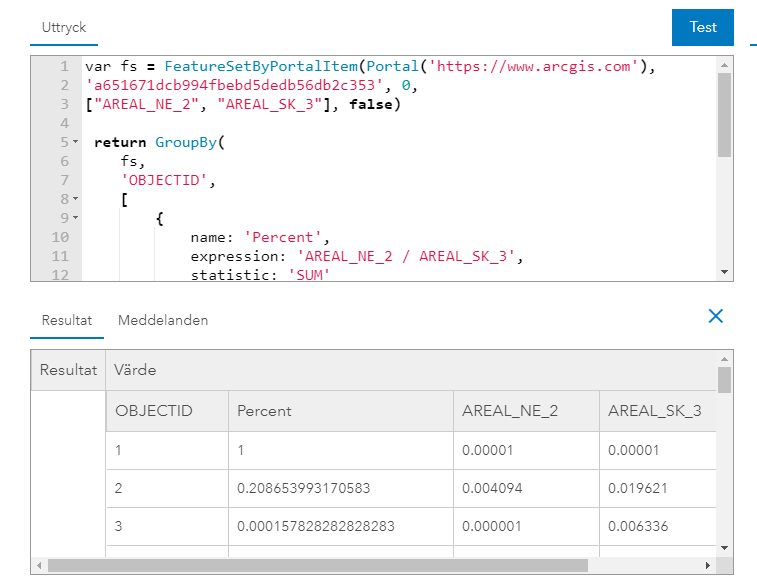
Your code works very good with another dataset I did for trial, but it gives no output for the data set I needed (maybe because I don't own it or because I choose wrong layerId). I will attach printscreens!
But even with the dataset which looks good in the Test Results in the Edit Data expression screen, it strangely says "unable to execute Arcade script" in the list of choices of data for the indicator afterwards. I will attach printscreen also for this.
- Mark as New
- Bookmark
- Subscribe
- Mute
- Subscribe to RSS Feed
- Permalink
Sorry, I missed this response last week! I know you accepted the other response as the solution, but are you still seeing issues with your other dataset?
Kendall County GIS
- Mark as New
- Bookmark
- Subscribe
- Mute
- Subscribe to RSS Feed
- Permalink
Hi there! Oh no problem. Yes, I was accepting the other response as the solution because the code itself works, but only with the dataset that I own and not with my company dataset. I have asked them to look at my permissions for the dataset if that's what's blocking me from doing data expressions on it. /Elinor