- Home
- :
- All Communities
- :
- Products
- :
- ArcGIS Dashboards
- :
- ArcGIS Dashboards Questions
- :
- Re: Customize label when hovering above bar chart
- Subscribe to RSS Feed
- Mark Topic as New
- Mark Topic as Read
- Float this Topic for Current User
- Bookmark
- Subscribe
- Mute
- Printer Friendly Page
Customize label when hovering above bar chart
- Mark as New
- Bookmark
- Subscribe
- Mute
- Subscribe to RSS Feed
- Permalink
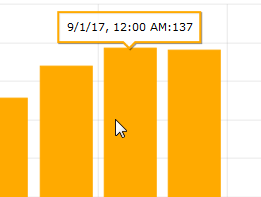
When I hover over a bar on a chart that is showing the total for that category the hover label shows a date, time:count. e.g. 9/1/17, 12:00 AM: 128. The underlying map's popup does not have the time part checked.
Is it possible to customize this label? In this case all I want to show is the count.

Solved! Go to Solution.
Accepted Solutions
- Mark as New
- Bookmark
- Subscribe
- Mute
- Subscribe to RSS Feed
- Permalink
At this time this is not customizable. However, there are plans to enhance the hover text to make it more flexible. I'm not sure on the timeline for this enhancement.
- Mark as New
- Bookmark
- Subscribe
- Mute
- Subscribe to RSS Feed
- Permalink
At this time this is not customizable. However, there are plans to enhance the hover text to make it more flexible. I'm not sure on the timeline for this enhancement.
- Mark as New
- Bookmark
- Subscribe
- Mute
- Subscribe to RSS Feed
- Permalink
It looks like it has been a while since this post was created. Has the customizable hover text enhancement been completed yet? Thank you!
- Mark as New
- Bookmark
- Subscribe
- Mute
- Subscribe to RSS Feed
- Permalink
I'm also interested in customizing hover text in a dashboard I'm building. Similarly wondering if the functionality is ready.
- Mark as New
- Bookmark
- Subscribe
- Mute
- Subscribe to RSS Feed
- Permalink
I too am interested in this functionality.
- Mark as New
- Bookmark
- Subscribe
- Mute
- Subscribe to RSS Feed
- Permalink
@Anonymous User ditto...any updates?
- Mark as New
- Bookmark
- Subscribe
- Mute
- Subscribe to RSS Feed
- Permalink
Hi @Anonymous User,
Are there any updates on this subject?
We are in a position where we have graphs summing up stats by year, but where the label shows 1.1.YEAR. For our users, this is causing a lot of confusion.
Would also take suggestions towards alternative ways of solving this.
- Mark as New
- Bookmark
- Subscribe
- Mute
- Subscribe to RSS Feed
- Permalink
6 years latter no updates on this? I want to show absolut value in axis but percentage in hover text, or use dates just with yyyy format in hover text, but this is still not possible. Could you please fix this?
- Mark as New
- Bookmark
- Subscribe
- Mute
- Subscribe to RSS Feed
- Permalink
Is there a way to have the hover text in a Serial Chart reflect the alias of the value field? I've created an alias both in the data being published (and via the web map), but the hover text still reflects the original field name and not the alias.
