- Home
- :
- All Communities
- :
- Products
- :
- ArcGIS Dashboards
- :
- ArcGIS Dashboards Questions
- :
- Re: Count of one field based on another field in c...
- Subscribe to RSS Feed
- Mark Topic as New
- Mark Topic as Read
- Float this Topic for Current User
- Bookmark
- Subscribe
- Mute
- Printer Friendly Page
Count of one field based on another field in charts
- Mark as New
- Bookmark
- Subscribe
- Mute
- Subscribe to RSS Feed
- Permalink
Hi,
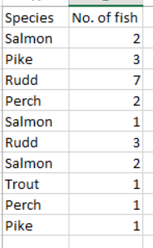
How do I create a chart showing a count of one field based on another field.
For example below I have salmon appearing 3 times with the total count of 5. I'd like the chart to show Salmon 5, Pike 4, Rudd 10, Perch 3 etc. rather than just counting the species field.
If I use Grouped Values it only lets me select the Species and the number of times they appear rather than the number of fish field.
Thanks
Rachel
Solved! Go to Solution.
Accepted Solutions
- Mark as New
- Bookmark
- Subscribe
- Mute
- Subscribe to RSS Feed
- Permalink
In your chart settings, simply change the Statistic to being Sum, and point it to the field No. of fish.
Kendall County GIS
- Mark as New
- Bookmark
- Subscribe
- Mute
- Subscribe to RSS Feed
- Permalink
In your chart settings, simply change the Statistic to being Sum, and point it to the field No. of fish.
Kendall County GIS
- Mark as New
- Bookmark
- Subscribe
- Mute
- Subscribe to RSS Feed
- Permalink
Thanks Josh,
I knew it was in there somewhere. I was trying to get it under pie charts.
That's me sorted.
Many thanks for the help.
- Mark as New
- Bookmark
- Subscribe
- Mute
- Subscribe to RSS Feed
- Permalink
Oh, those same settings apply to pie charts, too!
Kendall County GIS
- Mark as New
- Bookmark
- Subscribe
- Mute
- Subscribe to RSS Feed
- Permalink
I just see that, thank a million.


