- Home
- :
- All Communities
- :
- Products
- :
- ArcGIS Dashboards
- :
- ArcGIS Dashboards Questions
- :
- Can you have different layouts in the same dashboa...
- Subscribe to RSS Feed
- Mark Topic as New
- Mark Topic as Read
- Float this Topic for Current User
- Bookmark
- Subscribe
- Mute
- Printer Friendly Page
Can you have different layouts in the same dashboard
- Mark as New
- Bookmark
- Subscribe
- Mute
- Subscribe to RSS Feed
- Permalink
I have three different Categories where I would like to have each category have its own layout page on the same dashboard. Something similar to the Arizona Disaster Mitigation Projects for 2010 current Dashboard, where on the top right each year has a button to display that specific year's data. How do you create those buttons?
- Mark as New
- Bookmark
- Subscribe
- Mute
- Subscribe to RSS Feed
- Permalink
I was able to create a dashboard similar to the Law Enforcement Daily Activity Dashboard example where there are tabs in the lower-left. Steps to do that:
- You need a unique web map for each of the tabs designed to match the layouts you have.
- As you add each web map, when you click the "Drag Item" button, you can dock the maps "on top of each other" (let go of the map in the center of the other one when it says "Stack the items").
- Then you can start adding other elements (chart, list, guage, etc), click "Drag Item" and hold the shift key to dock them in the tab of your choice. When you hold the shift key the docking areas turn green.
I think the year buttons in the Arizona Disaster Mitigation Projects dashboard are Category Selectors in a Header, which makes them queries of the single web map. I could be wrong about that though.
- Mark as New
- Bookmark
- Subscribe
- Mute
- Subscribe to RSS Feed
- Permalink
Hi Eric,
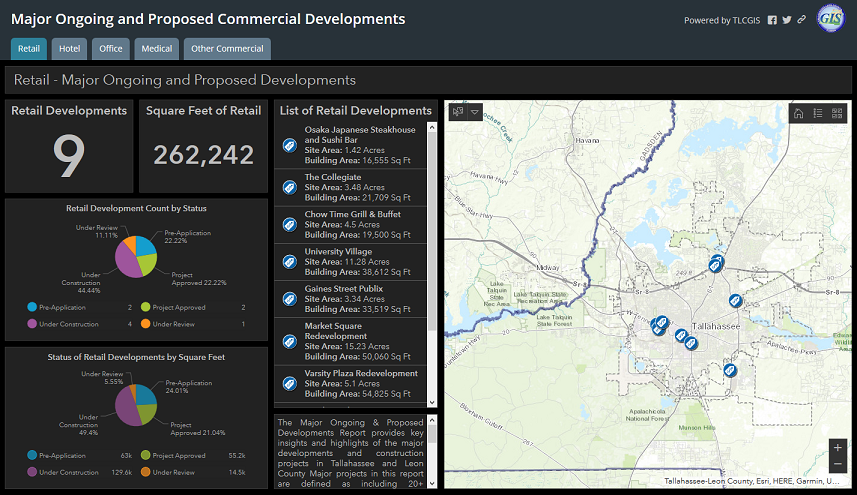
In addition to Brian's approach (e.g., stacking dashboard elements), another approach you could take is to embed different Dashboards within a Story Map app - the Map Series tabbed layout.
An example, Major Ongoing and Proposed Commercial Developments - City of Tallahasee
Hope this helps,