- Home
- :
- All Communities
- :
- Products
- :
- ArcGIS Dashboards
- :
- ArcGIS Dashboards Questions
- :
- Arcade data expression: Calculate the percentage o...
- Subscribe to RSS Feed
- Mark Topic as New
- Mark Topic as Read
- Float this Topic for Current User
- Bookmark
- Subscribe
- Mute
- Printer Friendly Page
Arcade data expression: Calculate the percentage of total based on GroupBy() results
- Mark as New
- Bookmark
- Subscribe
- Mute
- Subscribe to RSS Feed
- Permalink
Hi,
today I got stuck writing a data expression that calculates the percentage of several categories based on the frequency of their mentioning in a survey.
To illustrate, I have a survey that allows the user to give multiple topics he would like to know more about in future trainings. These are split by the data expression into seperate rows in order to count them.
var fv = FeatureSetByPortalItem(Portal(p),itemID,layerID,
    ['future_support'],
    false );

var fv_f = Filter(fv,'future_support IS NOT NULL')

var dict = {
  fields: [
    { name: 'split_choices',        type: 'esriFieldTypeString' },
  ],
  geometryType: '',
  features: [],
};

var index = 0;

for (var feature in fv_f){
    var split_fv_f = Split(feature['future_support'],',')
    var count_arr = Count(split_fv_f)
    for(var i = 0; i < count_arr; i++ ){
        dict.features[index++] = {
            'attributes': {
                'split_choices': decode(Number(Trim(split_fv_f[i])),
            1,'Pruning & Rejuvenation',
            2,'Composting',
            3,'Integrated Pest & Disease Management',
            4,'Weeding ',
            5,'Nutrition',
            6,'Shade',
            7,'Mulching',
            8,'Erosion control',
            9,'Coffee planting',
            10,'Harvesting',
            11,'Sustainability',
            12,'Business Skills',
            99,'None',
            'other')
            }}
}}

var fs_dict = FeatureSet(Text(dict));
This is all fine, in the next step I would like to group and count per given answer. Easy task, just use the GroupBy() function:
return GroupBy(fs_dict, ['split_choices'],
       [{ name: 'split_count',
       expression: 'split_choices',
       statistic: 'COUNT' }]);
Which gives me the following:

Based on this, I can create a nice graph showing these counts, but I cannot tell the percentage of total per question. The total is easly calcuated as variable by counting the filtered result of fv_f. So I would basically like to perform per each row in the above picture an additional calculation to get the percentage.
I tried to use the GroupBy() FS I get in another for-loop but that didn't seem to work, as I am not able to reference the fields correctly, namely split_count.
Any ideas?
All the best,
merlin
Solved! Go to Solution.
Accepted Solutions
- Mark as New
- Bookmark
- Subscribe
- Mute
- Subscribe to RSS Feed
- Permalink
You should keep in mind that if you have a FeatureSet, the chart itself can handle the GroupBy function.
I can have a Data Expression that returns a FeatureSet:

And then let the chart handle the grouping for me by setting it to Grouped Values and choose various statistics.

But to more directly address your issue, you can add another field in your GroupBy to get the percentage, by earlier calculating the total number of responses. Try this:
var fv = FeatureSetByPortalItem(
    Portal(p),
    itemID,
    layerID,
    ['future_support'],
    false
);

var fv_f = Filter(fv,'future_support IS NOT NULL');

// Get the total number of records in the filtered fs
var fv_tot = Count(fv_v);

var features = [];
var feat;

for (var feature in fv_f){
    var split_fv_f = Split(feature['future_support'],',')
    var count_arr = Count(split_fv_f)
    for(var i = 0; i < count_arr; i++ ){
        feat = {
            'attributes': {
                'split_choices': decode(Number(Trim(split_fv_f[i])),
            1,'Pruning & Rejuvenation',
            2,'Composting',
            3,'Integrated Pest & Disease Management',
            4,'Weeding ',
            5,'Nutrition',
            6,'Shade',
            7,'Mulching',
            8,'Erosion control',
            9,'Coffee planting',
            10,'Harvesting',
            11,'Sustainability',
            12,'Business Skills',
            99,'None',
            'other')
            }}

        Push(features, feat);
}}

var dict = {
  fields: [
    { name: 'split_choices', type: 'esriFieldTypeString' }
  ],
  geometryType: '',
  features: features
};

var fs_dict = FeatureSet(Text(dict));

// Use total from above to get the percentage values
return GroupBy(fs_dict, ['split_choices'],
        [{
            name: 'split_count',
            expression: 'split_choices',
            statistic: 'COUNT'
         },
         {
            name: 'split_percentage',
            expression: '1 / @fv_tot',
            statistic: 'SUM'
          ]);
By using the expression 1 / @ fv_t, your GroupBy function will calculate the per-response percentage, then sum them. For example, each single response out of 2208 responses is worth about 0.000453. If 370 of my responses fall into a given category, then the total percentage of responses that chose that category would be 16.76%.
Kendall County GIS
- Mark as New
- Bookmark
- Subscribe
- Mute
- Subscribe to RSS Feed
- Permalink
You should keep in mind that if you have a FeatureSet, the chart itself can handle the GroupBy function.
I can have a Data Expression that returns a FeatureSet:
And then let the chart handle the grouping for me by setting it to Grouped Values and choose various statistics.
But to more directly address your issue, you can add another field in your GroupBy to get the percentage, by earlier calculating the total number of responses. Try this:
var fv = FeatureSetByPortalItem(
    Portal(p),
    itemID,
    layerID,
    ['future_support'],
    false
);

var fv_f = Filter(fv,'future_support IS NOT NULL');

// Get the total number of records in the filtered fs
var fv_tot = Count(fv_v);

var features = [];
var feat;

for (var feature in fv_f){
    var split_fv_f = Split(feature['future_support'],',')
    var count_arr = Count(split_fv_f)
    for(var i = 0; i < count_arr; i++ ){
        feat = {
            'attributes': {
                'split_choices': decode(Number(Trim(split_fv_f[i])),
            1,'Pruning & Rejuvenation',
            2,'Composting',
            3,'Integrated Pest & Disease Management',
            4,'Weeding ',
            5,'Nutrition',
            6,'Shade',
            7,'Mulching',
            8,'Erosion control',
            9,'Coffee planting',
            10,'Harvesting',
            11,'Sustainability',
            12,'Business Skills',
            99,'None',
            'other')
            }}

        Push(features, feat);
}}

var dict = {
  fields: [
    { name: 'split_choices', type: 'esriFieldTypeString' }
  ],
  geometryType: '',
  features: features
};

var fs_dict = FeatureSet(Text(dict));

// Use total from above to get the percentage values
return GroupBy(fs_dict, ['split_choices'],
        [{
            name: 'split_count',
            expression: 'split_choices',
            statistic: 'COUNT'
         },
         {
            name: 'split_percentage',
            expression: '1 / @fv_tot',
            statistic: 'SUM'
          ]);
By using the expression 1 / @ fv_t, your GroupBy function will calculate the per-response percentage, then sum them. For example, each single response out of 2208 responses is worth about 0.000453. If 370 of my responses fall into a given category, then the total percentage of responses that chose that category would be 16.76%.
Kendall County GIS
- Mark as New
- Bookmark
- Subscribe
- Mute
- Subscribe to RSS Feed
- Permalink
Excellent, thanky you very much, works like a charm!
I have one minor change/improvement:
I just used 100 / @ fv_t, to get the percentage I want to display right away.


- Mark as New
- Bookmark
- Subscribe
- Mute
- Subscribe to RSS Feed
- Permalink
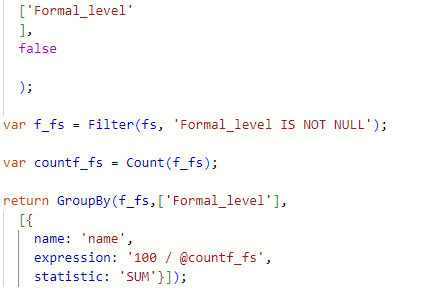
I am trying to achieve something same result on my end but can't seem to get it right. I am trying to calculate percentage for categories in a field on a single choice question.
I am definately missing something. Please help. see what I did below