Turn on suggestions
Auto-suggest helps you quickly narrow down your search results by suggesting possible matches as you type.
Cancel
- Home
- :
- All Communities
- :
- Products
- :
- ArcGIS Dashboards
- :
- ArcGIS Dashboards Ideas
- :
- Line chart Widget in Operation Dashboard for ArcGI...
Options
- Subscribe to RSS Feed
- Mark as New
- Mark as Read
- Bookmark
- Follow this Idea
- Printer Friendly Page
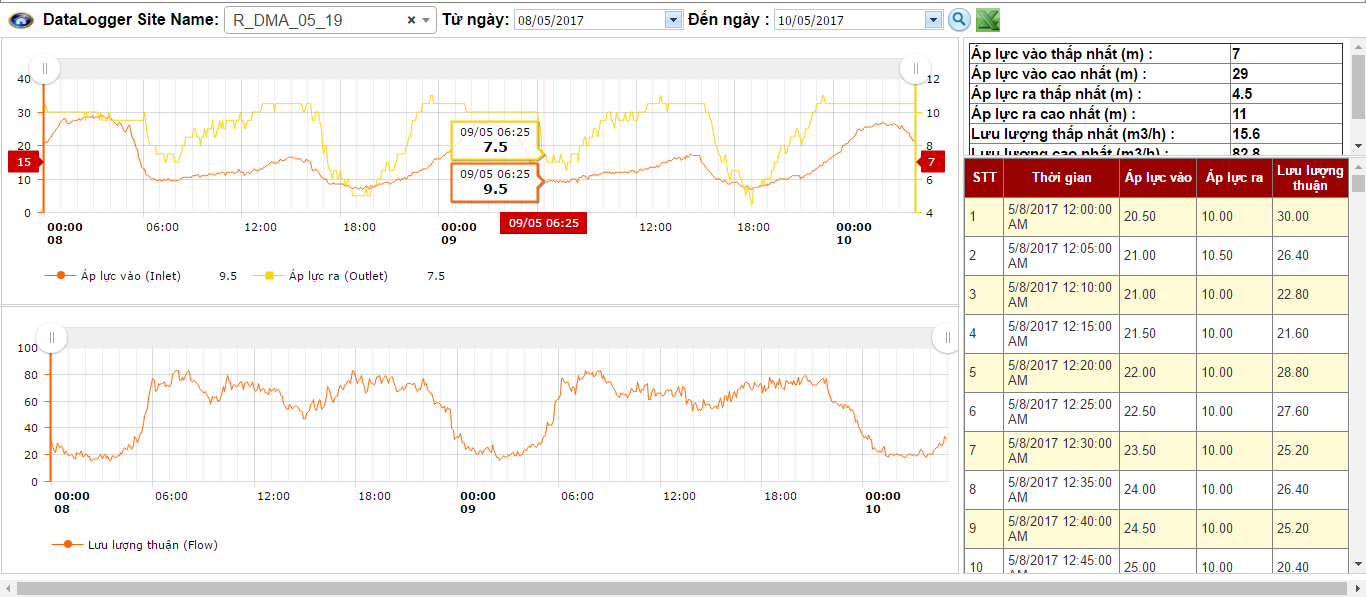
Line chart Widget in Operation Dashboard for ArcGIS
Follow this Idea
3709
3
05-09-2017 04:07 PM
Status:
Already Offered
3 Comments
Hi bigbaer, Did you try the AGOL version of Operations Dashboard? Line charts are available there.
HTH
Annina
Status changed to:
Already Offered
@PhuNguyen Since this post was submitted, ArcGIS Dashboards has come a long way. As @AnninaHirschi_Wyss1 suggests, what you're looking for can be done with a serial chart.
You must be a registered user to add a comment. If you've already registered, sign in. Otherwise, register and sign in.