- Home
- :
- All Communities
- :
- Products
- :
- ArcGIS CityEngine
- :
- ArcGIS CityEngine Documents
- :
- DataViz.cga
- Subscribe to RSS Feed
- Mark as New
- Mark as Read
- Bookmark
- Subscribe
- Printer Friendly Page
DataViz.cga
DataViz.cga
Hello Geonet Community,
This is David Wasserman, the urban planner/programmer who wrote up the Complete_Street.CGA rule featured in the Complete Street 2014 Example. Since the complete street rule was an article covering it was released by the Green Lane Project, and a large discussion page on the street rule has formed by users learning how to use it.
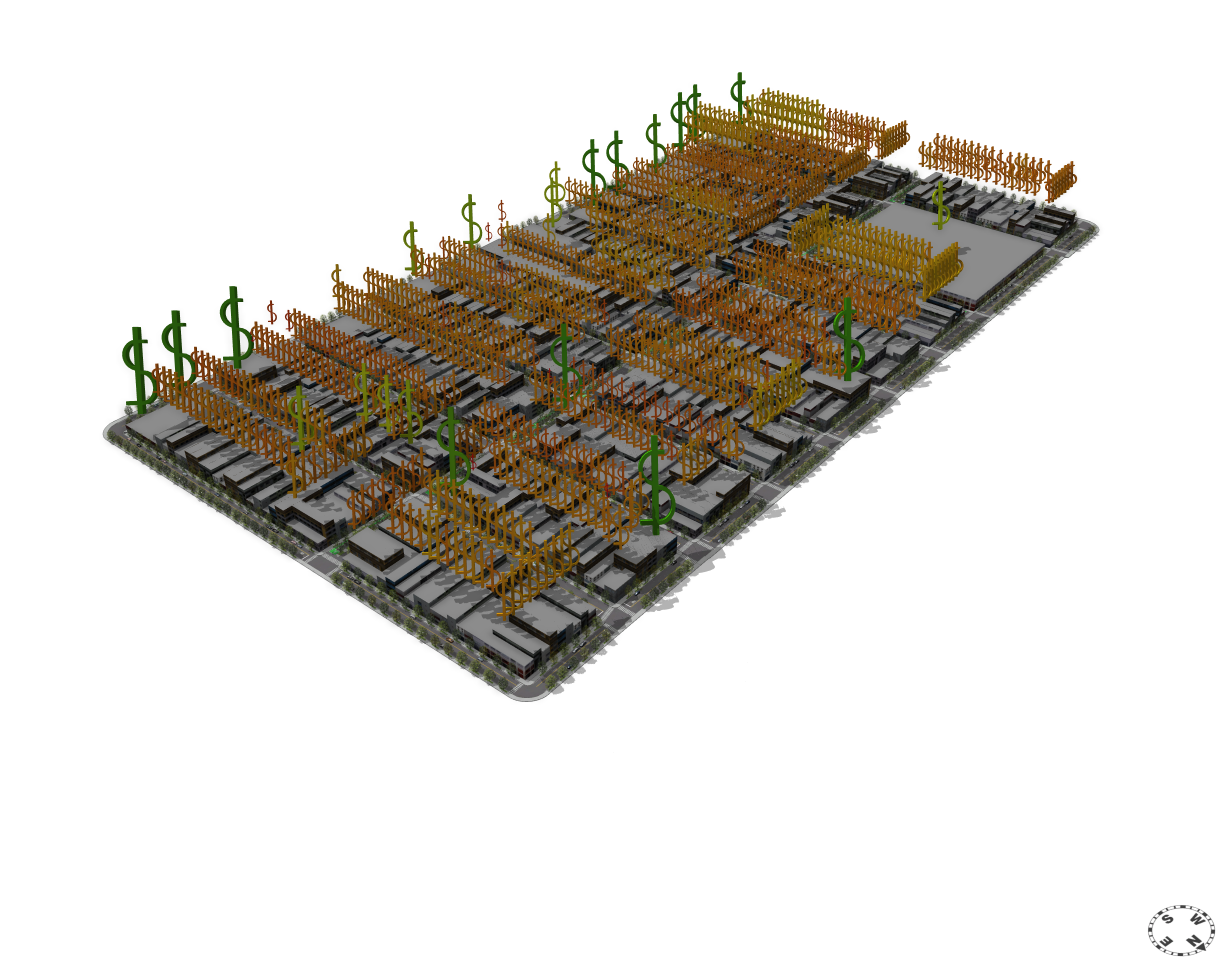
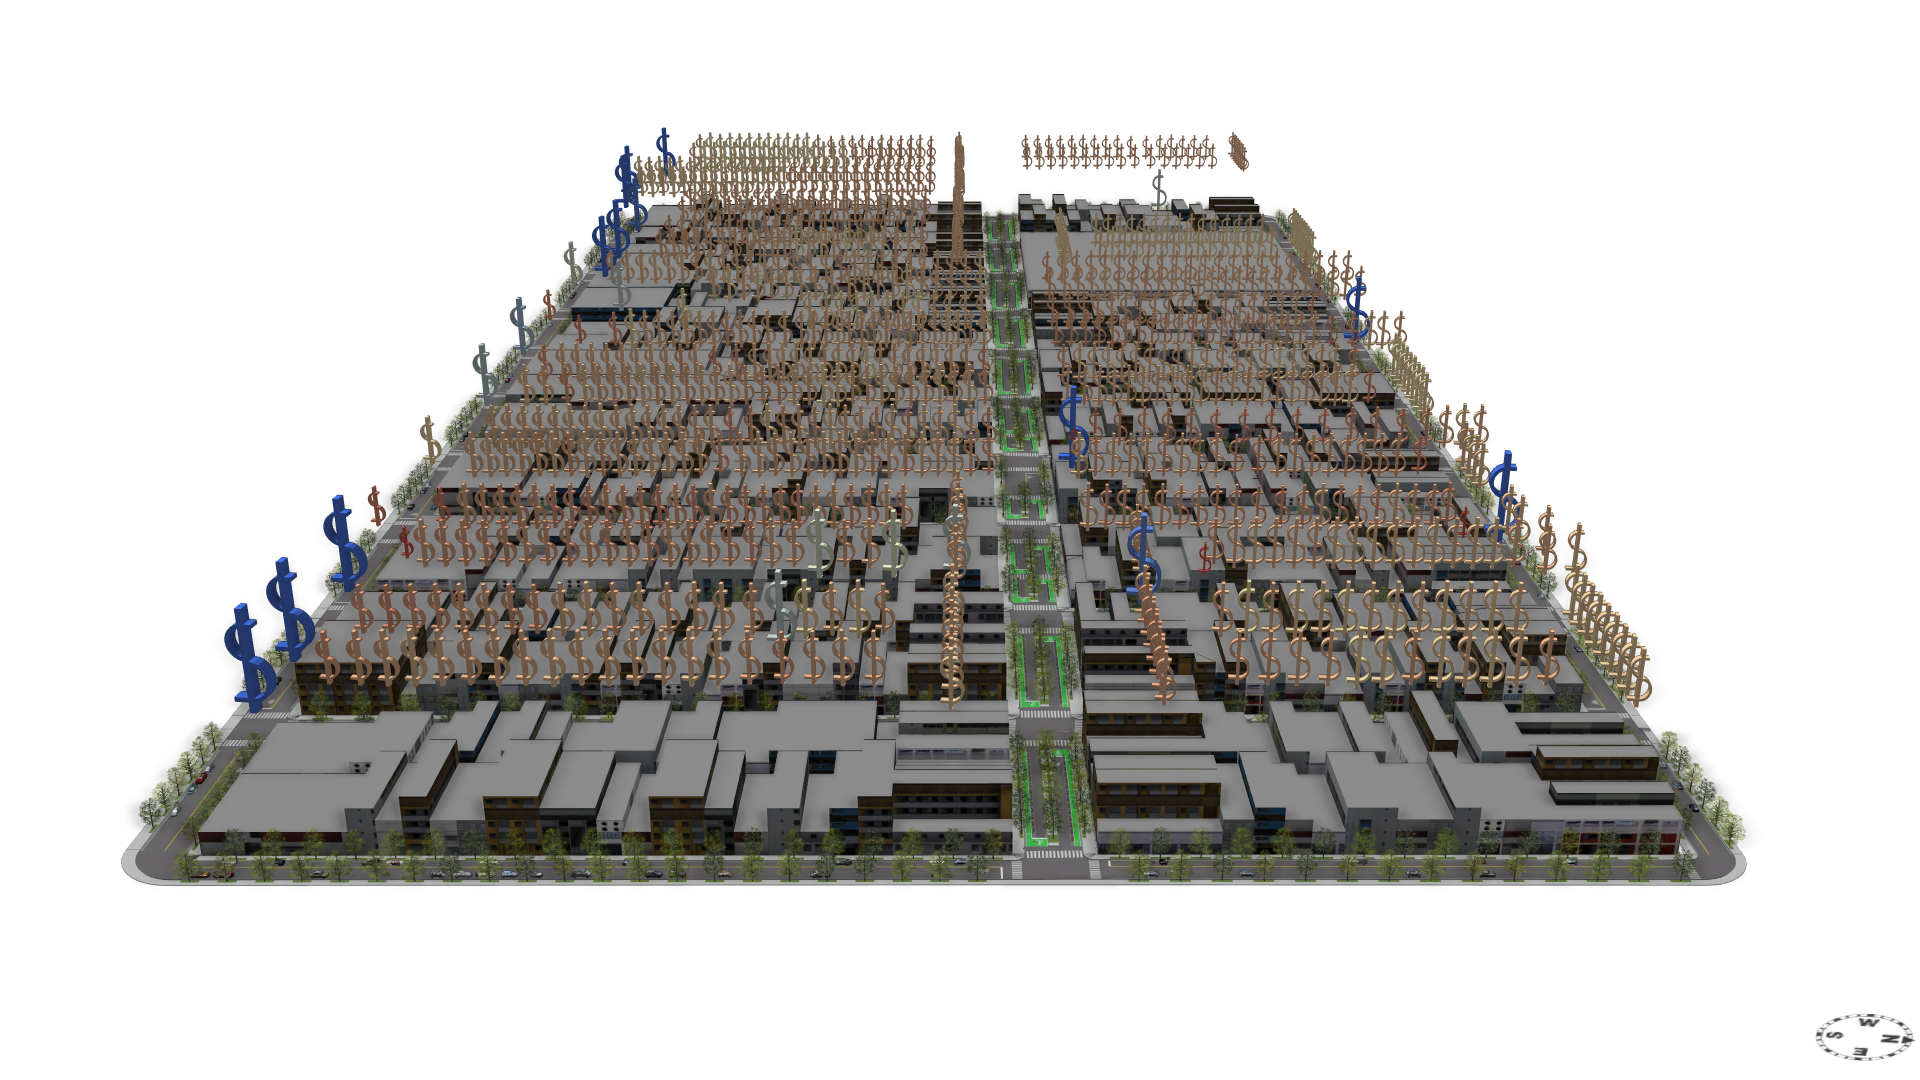
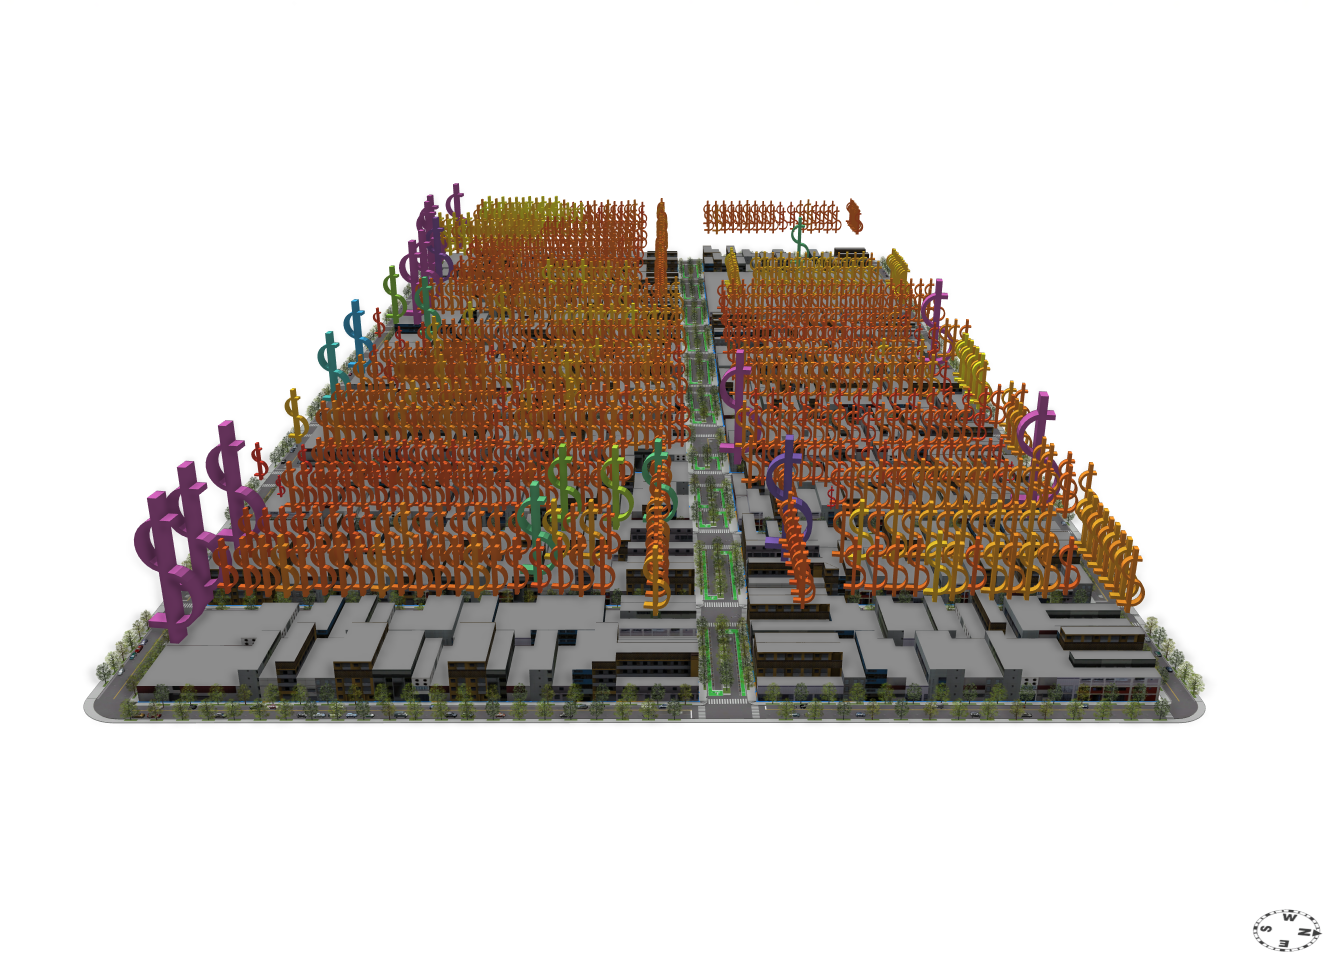
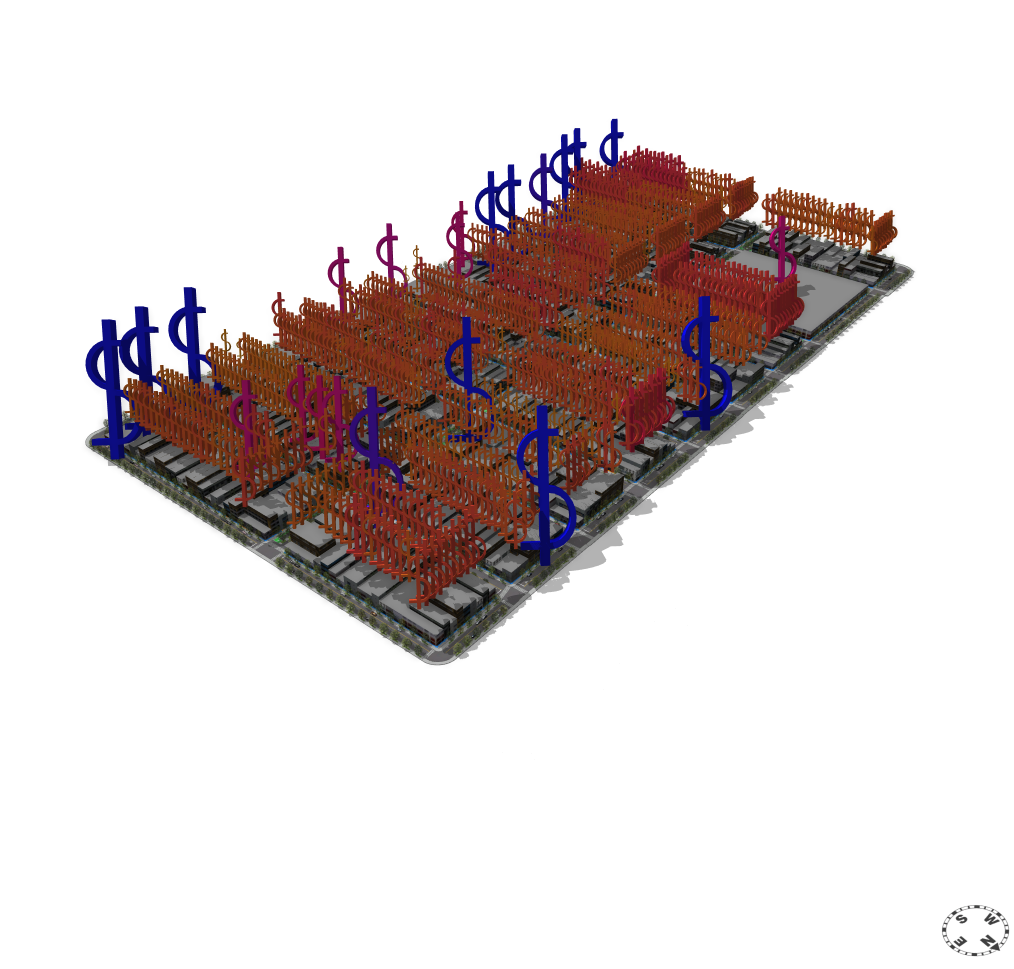
Also the Geodesign conference has passed us by, but during the conference I got inspired to write a quick rule for the dedicated purpose of data visualization within CityEngine. The rule conveys information in 3 ways:
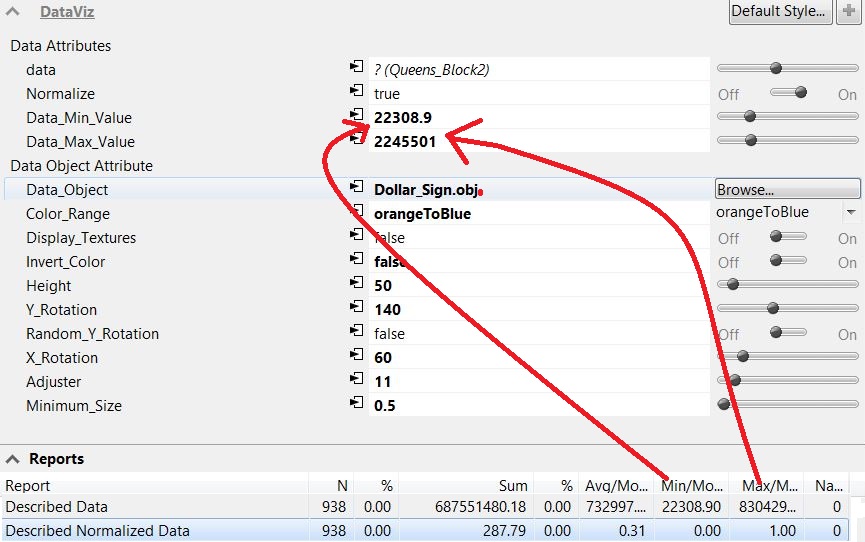
1. The rule has a file picker that allows you to select an obj to represent what you are measuring. The object itself is closely related to what you want to convey, so you could pick dollar signs for AssessedValue/Acre (seen below) or even a car or pedestrian to represent travel trips generated.
2. The data visualization rule will re-size the object based on the magnitude of that data on a 0 to 1 scale.
3. The data visualization rule will then color the object based on the magnitude of the data on a 0 to 1 scale, utilizing all the the colors available in the color ramp functions (even allowing you to invert the color).
How to Use it:
1. Import the rule and then place the "Data_Viz" rule it on a base shape (lot, street, building), or a shape that faces the sky (vertically, like a roof).
2. Map what ever data or information you are conveying using the Connection Editor to the layer and attribute you want to visualize. In the pictures below, I simply mapped to the layer and selected the attribute I calculated in ArcMap.
3. Normalize your data on a 0-1 scale. The rule will normalize data for you using a common max-min formula (anything outside the min and max are set to 0 and 1 respectively). The rule has a built in reporting on the data to find the minimum and the maximum, but I suggested using a classification scheme in ArcMap like Natural Breaks/Geometric Interval or selecting your min and max values to normalize the values based on the standard deviation and distribution of the data (check your skew and kurtosis etc). Play with the Data_Min_Value, and Data_Max_Values.
4. Once your data is normalized on a 0-1 scale you will notice the built in cubes begin to be scoped appropriately. You can now select your obj of choice, color range (invert if you need to), and adjust the "Adjuster" and "Minimum Size" attributes to get your object of choice scaled appropriately. Keep in mind that the adjuster and minimum size attributes are multipliers of the original scope of the inserted object. You even have the option of adjusting the angles on which the objects are aligned to serve better vantage points.
5. Just explore applications and share them back here if you have any.
I intend to make a video later, but I figured I would post this for now. If you have any questions don't hesitate to ask.
David
Ahahahaha, David Wasserman just posted a big crazy rule, and I just posted Circle.cga!!! 
Its like we planned it or something...=)
YOU DID IT!!!! I thought you built victoria secret logo at first aHAHAHA!!!
Thanks for pushing me to make it. 😃
Added the @CGA Rule Library tag.