- Home
- :
- All Communities
- :
- Products
- :
- ArcGIS Business Analyst
- :
- ArcGIS Business Analyst Questions
- :
- infographics
- Subscribe to RSS Feed
- Mark Topic as New
- Mark Topic as Read
- Float this Topic for Current User
- Bookmark
- Subscribe
- Mute
- Printer Friendly Page
infographics
- Mark as New
- Bookmark
- Subscribe
- Mute
- Subscribe to RSS Feed
- Permalink
Question on creating custom variables on a table, within Infographics.
Objective: on my custom infographics to show counts # of stores that are within a selected geography
I'm using my imported Web Maps and Layers of about 100 locations of interest (stores).
Example: When I "Select Geography" for example and chose from "Counties", and there are 3 stores within that selected county, I'd like to show tally the locations, i.e. the infographics display Stores = 3.
I believe this involves table with custom variables, but the 'Operators' doesn't have a count, just sum... and it's adding up the ID# of the locations. Example, 3 stores (100, 201, 111), shows up as 412 instead of 3.
Thank you.
- Mark as New
- Bookmark
- Subscribe
- Mute
- Subscribe to RSS Feed
- Permalink
Hello Huan Vo-Ta,
Please use this workflow:
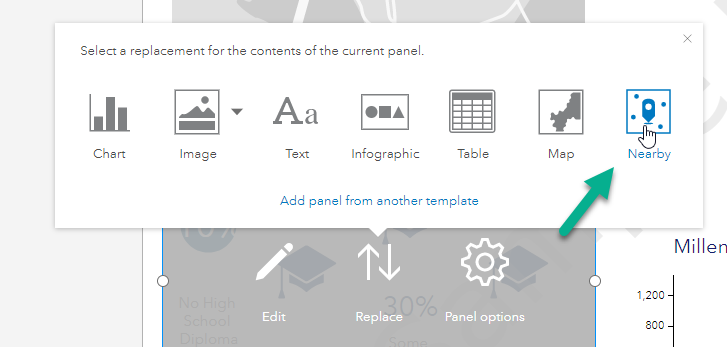
1. Go to Build Infographics > Open your template > add a Nearby table panel as follows:
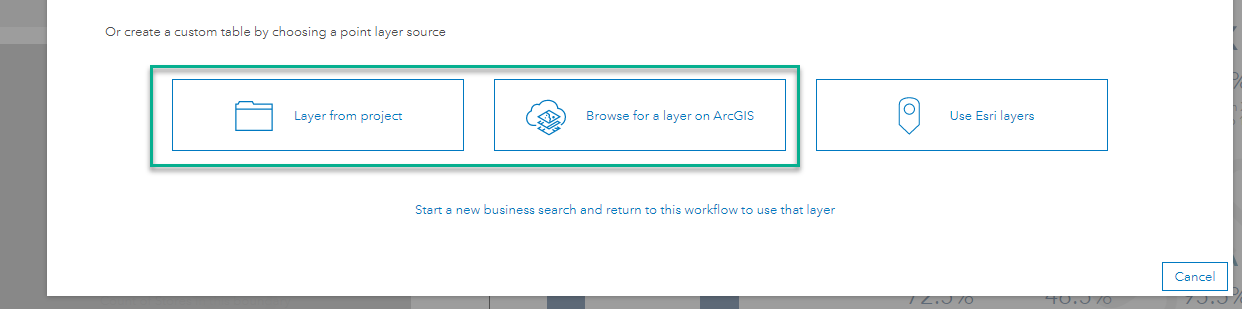
2. Click Layer from project or Browse for a layer in ArcGIS and select the point layer you want to summarize
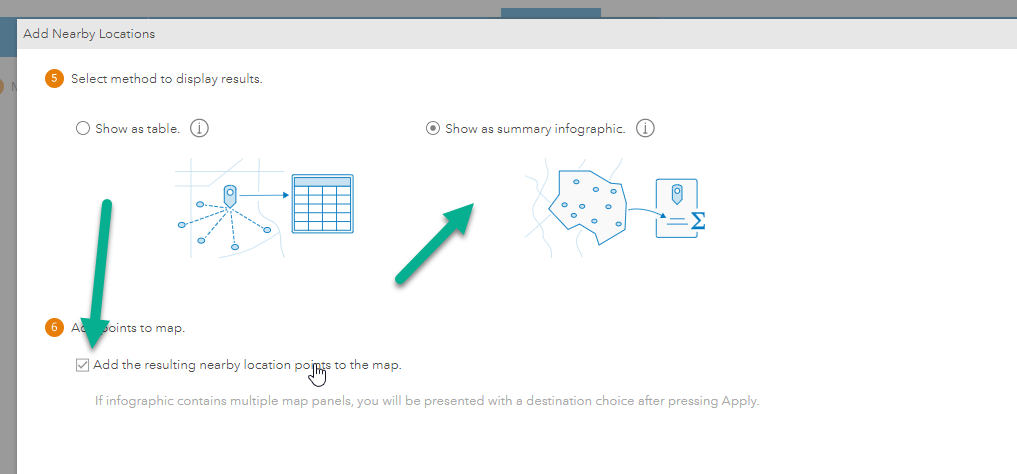
3. Select the desired fields from the input layer > Next > Next > select the Show as summary infographic option and check the map option as follows:
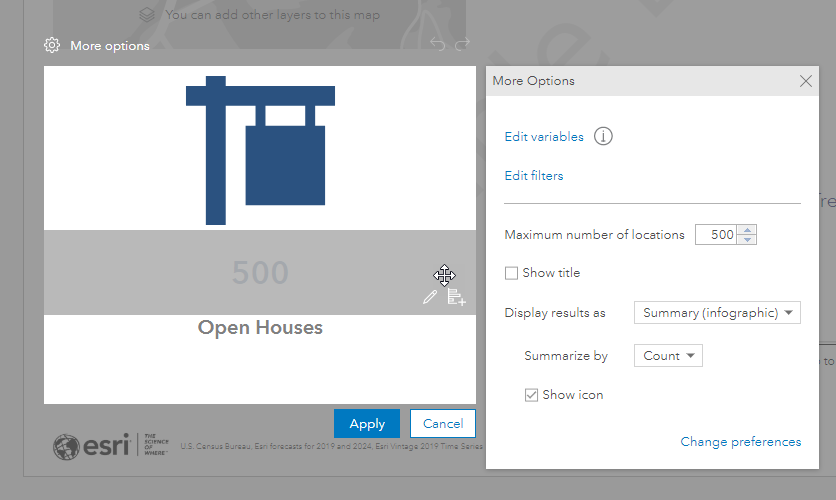
4. Add the desired icon and edit the labels and click Apply
5. Save your infographic and run it on the geography and you'll get the desired result:
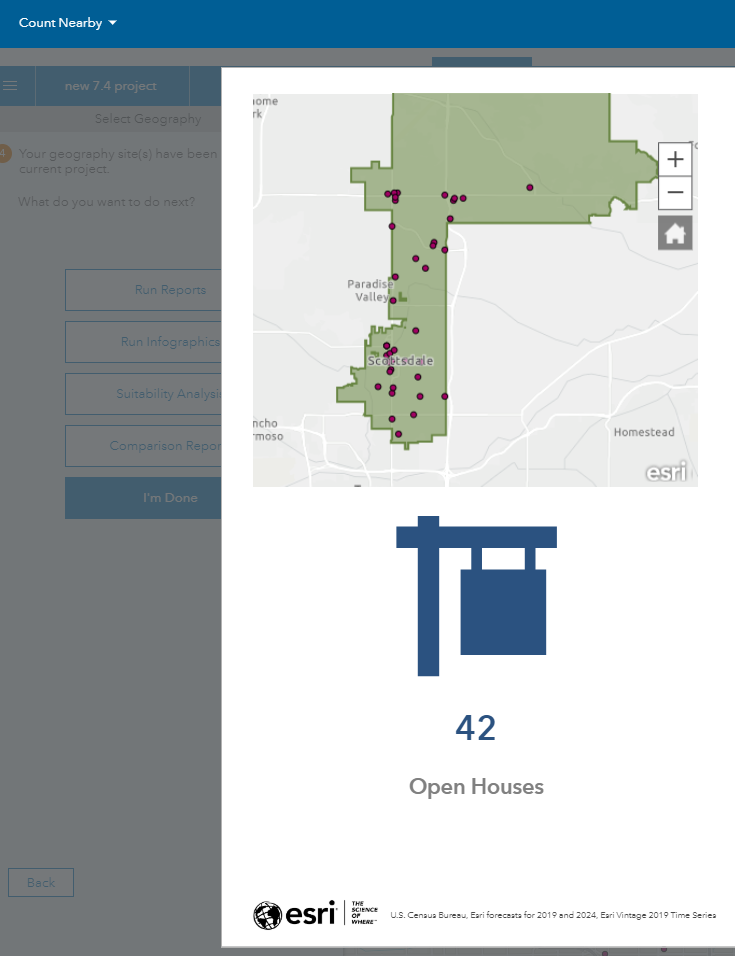
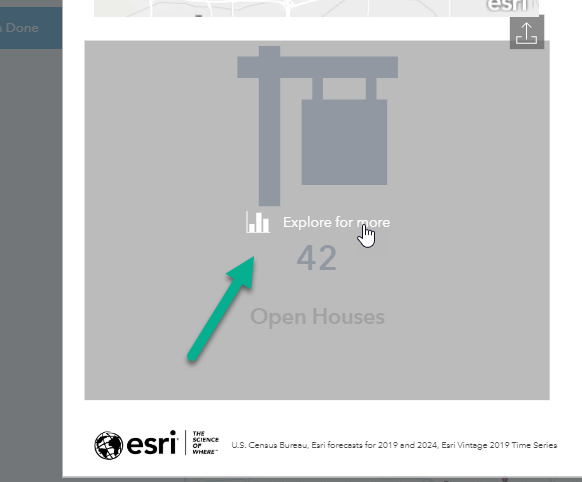
6. And you can click on Explore for more to see the details of those point features inside your target area:
I hope this helps.
Fasil T.
Business Analyst Team