Turn on suggestions
Auto-suggest helps you quickly narrow down your search results by suggesting possible matches as you type.
Cancel
- Home
- :
- All Communities
- :
- Developers
- :
- ArcGIS API for Python
- :
- ArcGIS API for Python Questions
- :
- Jupyter Lab spatial.plot local gdb multiple featur...
Options
- Subscribe to RSS Feed
- Mark Topic as New
- Mark Topic as Read
- Float this Topic for Current User
- Bookmark
- Subscribe
- Mute
- Printer Friendly Page
Jupyter Lab spatial.plot local gdb multiple feature classes
Subscribe
10-09-2020
11:42 AM
- Mark as New
- Bookmark
- Subscribe
- Mute
- Subscribe to RSS Feed
- Permalink
Hello Fellow GISers,
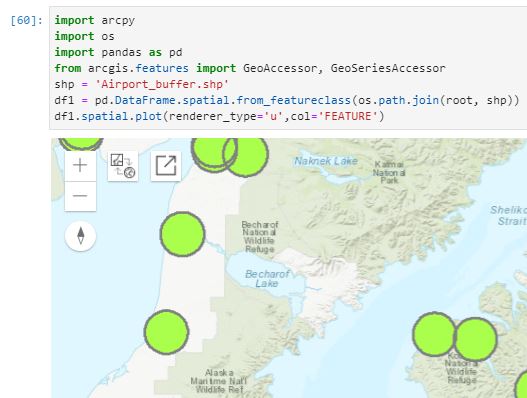
I have created a simple spatial.plot in Jupyter Lab notebook of a single local feature class. See image below for code and output. What I'm struggling with is adding another feature class to the same output (same map widget). I would prefer to keep it simple like below and not open a connection to ArcGIS online, especially since my feature classes are local. Any ideas? Thank you.
Tyler
Solved! Go to Solution.
1 Solution
Accepted Solutions
10-12-2020
06:50 PM
- Mark as New
- Bookmark
- Subscribe
- Mute
- Subscribe to RSS Feed
- Permalink
Hi Tyler Townes,
you can create another spatial dataframe and plot it to the same map widget:
df1 = pd.DataFrame.spatial.from_featureclass(path to feature class1)
df2 = pd.DataFrame.spatial.from_featureclass(path to feature class2)
mp = gis.map('area of interest')
mp
df1.spatial.plot(map_widget = mp, renderer_type = 'u', col = xxxx)
df2.spatial.plot(map_widget = mp, renderer_type = 'u', col = xxxx)
1 Reply
10-12-2020
06:50 PM
- Mark as New
- Bookmark
- Subscribe
- Mute
- Subscribe to RSS Feed
- Permalink
Hi Tyler Townes,
you can create another spatial dataframe and plot it to the same map widget:
df1 = pd.DataFrame.spatial.from_featureclass(path to feature class1)
df2 = pd.DataFrame.spatial.from_featureclass(path to feature class2)
mp = gis.map('area of interest')
mp
df1.spatial.plot(map_widget = mp, renderer_type = 'u', col = xxxx)
df2.spatial.plot(map_widget = mp, renderer_type = 'u', col = xxxx)