- Home
- :
- All Communities
- :
- Developers
- :
- JavaScript Maps SDK
- :
- JavaScript Maps SDK Questions
- :
- How to select graphic points within a polygon usin...
- Subscribe to RSS Feed
- Mark Topic as New
- Mark Topic as Read
- Float this Topic for Current User
- Bookmark
- Subscribe
- Mute
- Printer Friendly Page
How to select graphic points within a polygon using ArcGIS for JavaScript 4.6?
- Mark as New
- Bookmark
- Subscribe
- Mute
- Subscribe to RSS Feed
- Permalink
Hi,
I want to select all the points that lie inside a polygon (that I will be drawing). I want to do this using JavaScript API 4.6. Can anyone please help?
I know a sample code for JavaScript 3.23 exists here : Points in Extent
However, I need to achieve this using 4.6
- Mark as New
- Bookmark
- Subscribe
- Mute
- Subscribe to RSS Feed
- Permalink
Admin,
You can use the polygon classes contains method:
https://developers.arcgis.com/javascript/latest/api-reference/esri-geometry-Polygon.html#contains
- Mark as New
- Bookmark
- Subscribe
- Mute
- Subscribe to RSS Feed
- Permalink
The documentation says that the polygon will only recognize that the point is "contained" if it is on the polyline.
- Mark as New
- Bookmark
- Subscribe
- Mute
- Subscribe to RSS Feed
- Permalink
David,
No. You are mis-reading that.
Checks on the client if the input point is inside the polygon. A point on the polygon line is considered inside.
The first part of the above statement says if the point is inside the polygon. Then the second part additionally say that if a point is on line it is also considered inside.
- Mark as New
- Bookmark
- Subscribe
- Mute
- Subscribe to RSS Feed
- Permalink
I guess I just couldn't ever get it to work. I was hoping to use a Thessian Polygon layer I created to grab all of the points inside of their polygons in a loop and then to apply a wind trajectory to them. All of my layers are loaded in script using CSVs or JSON to Feature Layers (Not CSV Layers or Graphics Layers). I ended up settling for using a loop with nearestVertex using the original points like so:
While(Data.length > (i + 2))
{
nearest = geometryEngine.nearestVertex(psPoint.geometry,wsPoint[0].geometry);
for(z = 1; z < 160; z=z+1)
{
candidate = geometryEngine.nearestVertex(psPoint.geometry,wsPoint
if(candidate.distance < nearest.distance)
{
nearest = candidate;
array = z;
}
}
if(direction[array] >= 180)
{
mathdirection = direction[array] - 180;
}
else {
mathdirection = direction[array] + 180;
}
ptLatitude = parseFloat(pLatitude) + ((Math.sin(mathdirection * Math.PI / 180) * speed[array] )/69);
ptLongitude = parseFloat(pLongitude) + ((Math.cos(mathdirection * Math.PI / 180) * speed[array] )/69);
ptPoint =
),
I would really like to see how to get the other method to work with my wsPolygon layers.
- Mark as New
- Bookmark
- Subscribe
- Mute
- Subscribe to RSS Feed
- Permalink
Is the JSON and/or CSV data added as a GraphicsLayer or FeatureLayer?
- Mark as New
- Bookmark
- Subscribe
- Mute
- Subscribe to RSS Feed
- Permalink
wsPolyLayer = new FeatureLayer({
- Mark as New
- Bookmark
- Subscribe
- Mute
- Subscribe to RSS Feed
- Permalink
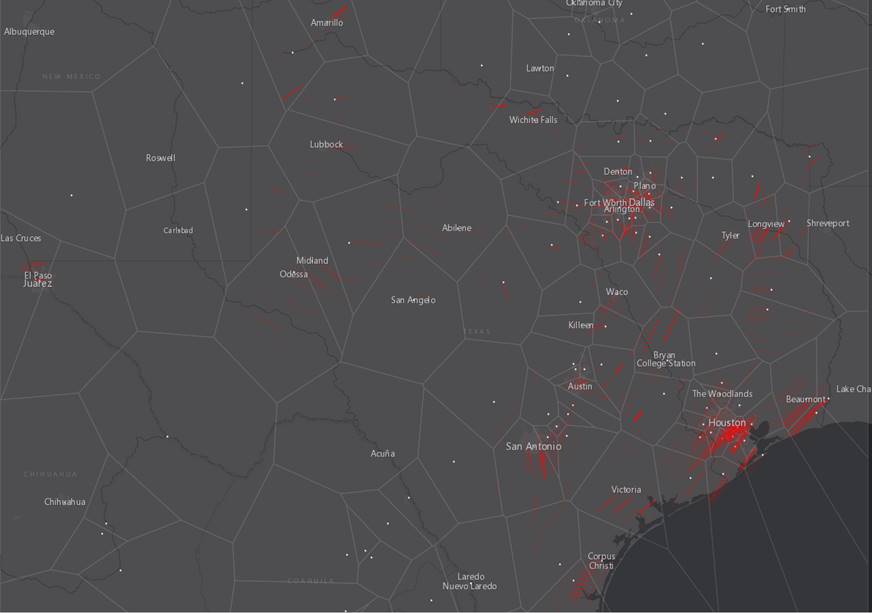
I'm not sure if I can send what it looks like in an image by replying through email. But, here is the visual:
nearestVertex provides the same exact results, but I'm thinking I can bring down my processing requirements quite a bit if I use the polygons to apply a change for wind speed and direction to all points within.
- Mark as New
- Bookmark
- Subscribe
- Mute
- Subscribe to RSS Feed
- Permalink
David,
Here is a sample that works with GraphicsLayers (which FeatureLayer extends from).
<!DOCTYPE html>
<html>
<head>
<meta charset="utf-8">
<meta name="viewport" content="initial-scale=1,maximum-scale=1,user-scalable=no">
<title>Sketch temporary geometries - 4.9</title>
<link rel="stylesheet" href="https://js.arcgis.com/4.9/esri/css/main.css">
<script src="https://js.arcgis.com/4.9/"></script>
<style>
html,
body,
#viewDiv {
padding: 0;
margin: 0;
height: 100%;
width: 100%;
font-family: verdana;
}
#topbar {
background: #fff;
position: absolute;
top: 15px;
right: 15px;
padding: 10px;
}
.action-button {
font-size: 16px;
background-color: transparent;
border: 1px solid #D3D3D3;
color: #6e6e6e;
height: 32px;
width: 32px;
text-align: center;
box-shadow: 0 0 1px rgba(0, 0, 0, 0.3);
}
.action-button:hover,
.action-button:focus {
background: #0079c1;
color: #e4e4e4;
}
.active {
background: #0079c1;
color: #e4e4e4;
}
</style>
<script>
require([
"esri/views/MapView",
"esri/Map",
"esri/widgets/Sketch/SketchViewModel",
"esri/Graphic",
"esri/layers/GraphicsLayer",
"esri/layers/FeatureLayer"
], function (
MapView, Map,
SketchViewModel, Graphic, GraphicsLayer, FeatureLayer
) {
let editGraphic;
// GraphicsLayer to hold graphics created via sketch view model
const graphicsLayer = new GraphicsLayer({
id: "tempGraphics"
});
const graphicsLayer2 = new GraphicsLayer({
id: "tempGraphics2"
});
const map = new Map({
basemap: "gray",
layers: [graphicsLayer, graphicsLayer2]
});
const view = new MapView({
container: "viewDiv",
map: map,
zoom: 11,
center: [-85.8077, 33.7702]
});
const pointSymbol = {
type: "simple-marker", // autocasts as new SimpleMarkerSymbol()
style: "square",
color: "#8A2BE2",
size: "16px",
outline: { // autocasts as new SimpleLineSymbol()
color: [255, 255, 255],
width: 3
}
};
const polylineSymbol = {
type: "simple-line", // autocasts as new SimpleLineSymbol()
color: "#8A2BE2",
width: "4",
style: "dash"
};
const polygonSymbol = {
type: "simple-fill", // autocasts as new SimpleFillSymbol()
color: "rgba(138,43,226, 0.8)",
style: "solid",
outline: {
color: "white",
width: 1
}
};
view.when(function () {
var featureLayer = new FeatureLayer({
url: "https://sampleserver6.arcgisonline.com/arcgis/rest/services/Census/MapServer/0",
outFields: ["*"]
});
featureLayer.load().then(function(evt){
// console.info(evt);
const queryParams = featureLayer.createQuery();
queryParams.where = "STATE_FIPS = '01' AND CNTY_FIPS ='015'";
queryParams.outSpatialReference = view.spatialReference;
queryParams.returnGeometry = true;
featureLayer.queryFeatures(queryParams).then(function(results){
var gras = results.features.map(function(gra){
gra.symbol = {
type: "simple-marker", // autocasts as new SimpleMarkerSymbol()
style: "circle",
color: "blue",
size: "8px", // pixels
outline: { // autocasts as new SimpleLineSymbol()
color: [ 255, 255, 0 ],
width: 0.5 // points
}};
return gra;
})
graphicsLayer2.addMany(gras);
});
});
// create a new sketch view model
const sketchViewModel = new SketchViewModel({
view,
layer: graphicsLayer,
pointSymbol,
polylineSymbol,
polygonSymbol
});
// Listen to create-complete event to add a newly created graphic to view
sketchViewModel.on("create-complete", addGraphic);
// called when sketchViewModel's create-complete event is fired.
function addGraphic(event) {
// Create a new graphic and set its geometry to
// `create-complete` event geometry.
const graphic = new Graphic({
geometry: event.geometry,
symbol: sketchViewModel.graphic.symbol
});
graphicsLayer.add(graphic);
// Query the Census point that are contained inside this graphics
var poly = graphic.geometry;
graphicsLayer2.graphics.forEach(function(gra, i){
var doesContain = poly.contains(gra.geometry);
if(doesContain){
gra.symbol = {
type: "simple-marker", // autocasts as new SimpleMarkerSymbol()
style: "circle",
color: "yellow",
size: "8px", // pixels
outline: { // autocasts as new SimpleLineSymbol()
color: [ 255, 255, 0 ],
width: 0.5 // points
}
};
}
});
}
// activate the sketch to create a polygon
var drawPolygonButton = document.getElementById("polygonButton");
drawPolygonButton.onclick = function () {
// set the sketch to create a polygon geometry
sketchViewModel.create("polygon");
setActiveButton(this);
};
// activate the sketch to create a rectangle
var drawRectangleButton = document.getElementById(
"rectangleButton");
drawRectangleButton.onclick = function () {
// set the sketch to create a polygon geometry
sketchViewModel.create("rectangle");
setActiveButton(this);
};
// activate the sketch to create a circle
var drawCircleButton = document.getElementById("circleButton");
drawCircleButton.onclick = function () {
// set the sketch to create a polygon geometry
sketchViewModel.create("circle");
setActiveButton(this);
};
// reset button
document.getElementById("resetBtn").onclick = function () {
sketchViewModel.reset();
graphicsLayer.removeAll();
setActiveButton();
graphicsLayer2.graphics.forEach(function(gra, i){
gra.symbol = {
type: "simple-marker", // autocasts as new SimpleMarkerSymbol()
style: "circle",
color: "blue",
size: "8px", // pixels
outline: { // autocasts as new SimpleLineSymbol()
color: [ 255, 255, 0 ],
width: 0.5 // points
}};
});
};
function setActiveButton(selectedButton) {
// focus the view to activate keyboard shortcuts for sketching
view.focus();
var elements = document.getElementsByClassName("active");
for (var i = 0; i < elements.length; i++) {
elements[i].classList.remove("active");
}
if (selectedButton) {
selectedButton.classList.add("active");
}
}
});
});
</script>
</head>
<body>
<div id="viewDiv">
<div id="topbar">
<button class="action-button esri-icon-polygon" id="polygonButton" type="button"
title="Draw polygon"></button>
<button class="action-button esri-icon-checkbox-unchecked" id="rectangleButton"
type="button" title="Draw rectangle"></button>
<button class="action-button esri-icon-radio-unchecked" id="circleButton"
type="button" title="Draw circle"></button>
<button class="action-button esri-icon-trash" id="resetBtn" type="button"
title="Clear graphics"></button>
</div>
</div>
</body>
</html>