- Home
- :
- All Communities
- :
- Developers
- :
- JavaScript Maps SDK
- :
- JavaScript Maps SDK Questions
- :
- How to create a hexagonal binning based map from G...
- Subscribe to RSS Feed
- Mark Topic as New
- Mark Topic as Read
- Float this Topic for Current User
- Bookmark
- Subscribe
- Mute
- Printer Friendly Page
How to create a hexagonal binning based map from GPS points based data
- Mark as New
- Bookmark
- Subscribe
- Mute
- Subscribe to RSS Feed
- Permalink
- Report Inappropriate Content
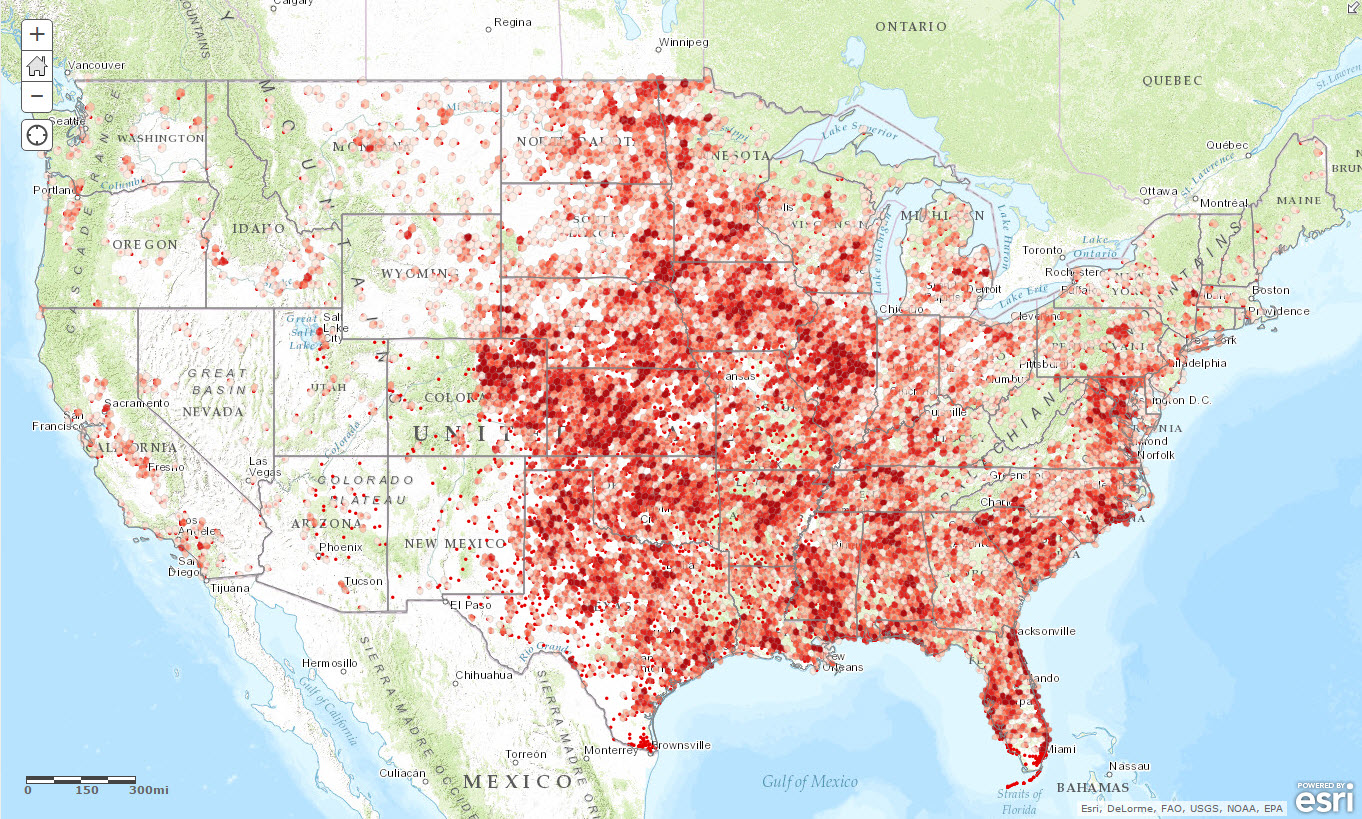
I have some huge number of GPS data which I want to plot on ArcGIS web map but in the form of hexagonal binning. The hexagons must be equal sized connected hexagons.
An example similar to my scenario I found on this link but it is for ArcGIS Desktop. See the snapshot below also.
I need to know how I can do that in latest version of ArcGIS API for Javascript 4.3.
Can someone please guide. Thanks.

- Mark as New
- Bookmark
- Subscribe
- Mute
- Subscribe to RSS Feed
- Permalink
- Report Inappropriate Content
I suspect that this question would best be directed elsewhere rather than the 3D space. Since you specify web map and java.. perhaps you could choose a more suitable place from the list provided here... If you need help moving it, let me know where you want it to go
- Mark as New
- Bookmark
- Subscribe
- Mute
- Subscribe to RSS Feed
- Permalink
- Report Inappropriate Content
My bad. That was a mistake. I have moved it to javascript category.
- Mark as New
- Bookmark
- Subscribe
- Mute
- Subscribe to RSS Feed
- Permalink
- Report Inappropriate Content
As far as I know there's nothing exactly like this in the web tier. This kind of thing is generally not done in the browser.
There is this: GitHub - nickcam/FlareClusterLayer: ArcGIS javascript custom graphics layer. Creates clusters and cr... which might meet your specifications, but may be too slow with a large number of points.
However, the example you linked isn't for arcgis desktop, it uses the web map viewer in ArcGIS online/ArcGIS Portal. Assuming your data is pulled in from a feature service, and you have access to AGOL/Portal, you should be able to follow the steps in that tutorial to get this effect.
The thing to note here is that this work is not done in the browser, it's done by creating a new feature service and using an aggregatePoints GP tool. All of this takes place on the back-end. Technically it would be possible to do this work in the client, but it would be fairly expensive and you wouldn't want to do it every time the map gets loaded,
- Mark as New
- Bookmark
- Subscribe
- Mute
- Subscribe to RSS Feed
- Permalink
- Report Inappropriate Content
Thanks Thomas for replying. Actually I am fairly new to ArcGIS. I will explain my issue a bit however.
Well, my GPS data will be totally dynamic based upon current zoom level plus some area.
In our old application we used google map to generate heat map based upon this GPS data. That GPS data comes via a REST service call and this call occurs whenever map's zoom changes and/or its center is changed by dragging.
Now how do I achieve that same thing in ArcGIS ?
- Mark as New
- Bookmark
- Subscribe
- Mute
- Subscribe to RSS Feed
- Permalink
- Report Inappropriate Content
It looks to me like the 3.21 API has a heatmap renderer that will do this work in the client: HeatmapRenderer | API Reference | ArcGIS API for JavaScript 3.21
This component isn't ready in 4.XX though.
How are you getting your GPS data? I mean how is it hosted?
- Mark as New
- Bookmark
- Subscribe
- Mute
- Subscribe to RSS Feed
- Permalink
- Report Inappropriate Content
My GPS data will come via a WCF service call based upon certain parameters.
- Mark as New
- Bookmark
- Subscribe
- Mute
- Subscribe to RSS Feed
- Permalink
- Report Inappropriate Content
OK it seems its some problem of my understanding regarding fundamentals of ArcGIS Online.
Actually we have our GPS data present in MongoDB and we need to show that data on an ArcGIS Map in hexagonal binning way.
As per my research, I will first need to have an ArcGIS online account, then create a hosted Feature Layer service on it.
Then import .geojson file into it and then consume this dataset from my Feature Layer service.
But my question is,
this way every time I will have to upload file to AcrGIS online thus to keep things in sync.
But this approach appears to me cumbersome.
Is there anyway that ArcGIS online can directly access data present in my MongoDB?
- Mark as New
- Bookmark
- Subscribe
- Mute
- Subscribe to RSS Feed
- Permalink
- Report Inappropriate Content
Any updates on this // the Esri 4.X JS API's native support for point aggregation?
Derek Law -- you might know this, yeah?
- Mark as New
- Bookmark
- Subscribe
- Mute
- Subscribe to RSS Feed
- Permalink
- Report Inappropriate Content
Andrew, HeatMap support was added in version 4.8 (July).