- Home
- :
- All Communities
- :
- Developers
- :
- JavaScript Maps SDK
- :
- JavaScript Maps SDK Questions
- :
- Get each polygon Id!
- Subscribe to RSS Feed
- Mark Topic as New
- Mark Topic as Read
- Float this Topic for Current User
- Bookmark
- Subscribe
- Mute
- Printer Friendly Page
Get each polygon Id!
- Mark as New
- Bookmark
- Subscribe
- Mute
- Subscribe to RSS Feed
- Permalink
Dear All,
I create a prototype which add a group of point to the map and create the drive time polygon around each point (Based on service area sample). The prototype is creating the polygons in the same time but i cannot control each polygon separately, i would like to create an Id for each polygon created around each point so i can use them for other query like polygon intersect ...
Below the code i create if anyone can help i will be grateful:
<!DOCTYPE html>
<html>
<head>
<meta http-equiv="Content-Type" content="text/html; charset=utf-8">
<meta http-equiv="X-UA-Compatible" content="IE=7, IE=9, IE=10">
<!--The viewport meta tag is used to improve the presentation and behavior of the samples
on iOS devices-->
<meta name="viewport" content="initial-scale=1, maximum-scale=1,user-scalable=no">
<title>Dispatch Algorithm Implementation</title>
<link rel="stylesheet" href="http://js.arcgis.com/3.9/js/dojo/dijit/themes/claro/claro.css">
<link rel="stylesheet" href="http://js.arcgis.com/3.9/js/esri/css/esri.css">
<style>
body,html,#main{margin:0;padding:0;height:100%;width:100%;}
</style>
<script>var dojoConfig = { parseOnLoad: true };</script>
<script src="http://js.arcgis.com/3.9/"></script>
<script>
dojo.require("esri.map");
dojo.require("esri.tasks.servicearea");
dojo.require("dijit.dijit");
dojo.require("dijit.layout.BorderContainer");
dojo.require("dijit.layout.ContentPane");
dojo.require("dijit.form.HorizontalSlider");
dojo.require("dijit.form.HorizontalRuleLabels");
dojo.require("dijit.form.HorizontalRule");
dojo.require("dijit.form.Button");
dojo.require("esri.graphic");
dojo.require("esri.tasks.geometry");
dojo.require("esri.layers.graphics");
dojo.require("esri.Color");
var map, serviceAreaTask, params, clickpoint, gsvc;
function init() {
esri.config.defaults.io.proxyUrl = "/proxy";
map = new esri.Map("map", {
basemap: "streets",
center: [-122.447, 37.781],
zoom: 14
});
params = new esri.tasks.ServiceAreaParameters();
params.defaultBreaks= [1];
params.outSpatialReference = map.spatialReference;
params.returnFacilities = false;
serviceAreaTask = new esri.tasks.ServiceAreaTask("http://sampleserver3.arcgisonline.com/ArcGIS/rest/services/Network/USA/NAServer/Service Area");
gsvc = new esri.tasks.GeometryService("http://tasks.arcgisonline.com/ArcGIS/rest/services/Geometry/GeometryServer");
dojo.connect(dijit.byId("hslider"), "onChange", updateHorizontalLabel);
updateHorizontalLabel();
}
// Create function that updates label when changed
function updateHorizontalLabel() {
// Get access to nodes/widgets we need to get/set values
var hSlider = dijit.byId("hslider");
var label = dojo.byId("decValue");
// Update label
label.innerHTML = hSlider.get("value");
params.defaultBreaks = [hSlider.value/60];
// if (typeof clickpoint != 'undefined') {
// AddDT(clickpoint);
// };
}
//Clears DTP
function ClearDTP() {
map.graphics.clear();
}
function AddDTP() {
map.graphics.clear(); //clear existing graphics
//define the symbology used to display the results and input point
var pointSymbol = new esri.symbol.PictureMarkerSymbol({
"angle":0,
"xoffset":0,
"yoffset":10,
"type":"esriPMS",
"url":"http://icons.iconarchive.com/icons/aha-soft/standard-transport/256/police-car-icon.png",
"contentType":"image/png",
"width":30,
"height":30
});
var m_mapPoint = [];
m_mapPoint[1] = new esri.geometry.Point([-122.447, 37.781],new esri.SpatialReference({ wkid:4326 }));
m_mapPoint[2] = new esri.geometry.Point([-122.457, 37.791],new esri.SpatialReference({ wkid:4326 }));
m_mapPoint[3] = new esri.geometry.Point([-122.450, 37.785],new esri.SpatialReference({ wkid:4326 }));
m_mapPoint[4] = new esri.geometry.Point([-122.452, 37.775],new esri.SpatialReference({ wkid:4326 }));
m_mapPoint[5] = new esri.geometry.Point([-122.452, 37.791],new esri.SpatialReference({ wkid:4326 }));
m_mapPoint[6] = new esri.geometry.Point([-122.450, 37.777],new esri.SpatialReference({ wkid:4326 }));
var location1 = new esri.Graphic(m_mapPoint[1],pointSymbol);
var location2 = new esri.Graphic(m_mapPoint[2],pointSymbol);
var location3 = new esri.Graphic(m_mapPoint[3],pointSymbol);
var location4 = new esri.Graphic(m_mapPoint[4],pointSymbol);
var location5 = new esri.Graphic(m_mapPoint[5],pointSymbol);
var location6 = new esri.Graphic(m_mapPoint[6],pointSymbol);
map.graphics.add(location1);
map.graphics.add(location2);
map.graphics.add(location3);
map.graphics.add(location4);
map.graphics.add(location5);
map.graphics.add(location6);
var features = [];
features.push(location1);
features.push(location2);
features.push(location3);
features.push(location4);
features.push(location5);
features.push(location6);
var facilities = new esri.tasks.FeatureSet();
facilities.features = features;
params.facilities = facilities;
//solve
serviceAreaTask.solve(params,function(solveResult){
var result = solveResult;
var serviceAreaSymbol = new esri.symbol.SimpleFillSymbol(
esri.symbol.SimpleFillSymbol.STYLE_SOLID,
new esri.symbol.SimpleLineSymbol(
esri.symbol.SimpleLineSymbol.STYLE_SOLID,
new dojo.Color([232,104,80]), 2
),
new dojo.Color([232,104,80,0.25])
);
var polygonSymbol = new esri.symbol.SimpleFillSymbol(esri.symbol.SimpleFillSymbol.STYLE_SOLID, new esri.symbol.SimpleLineSymbol(esri.symbol.SimpleLineSymbol.STYLE_SOLID,
new dojo.Color([232,104,80]), 2),new dojo.Color([232,104,80,0.25]));
dojo.forEach(solveResult.serviceAreaPolygons, function(serviceArea){
serviceArea.setSymbol(polygonSymbol);
map.graphics.add(serviceArea);
});
},function(err){
console.log(err.message);
});
}
dojo.ready(init);
</script>
</head>
<body class="claro">
<div data-dojo-type="dijit.layout.BorderContainer" data-dojo-props="design:'headline', gutters:false" style="width:100%;height:100%;margin:0px;">
<div data-dojo-type="dijit.layout.ContentPane" data-dojo-props="region:'left'">
<b>Choose your threshold to find the appropriate dispatch:</b>
<div style="width: 360px; margin: 10px">
<!-- create rules and labels above horizontal slider -->
<ol data-dojo-type="dijit.form.HorizontalRuleLabels"
data-dojo-props="
container: 'topDecoration',
style: 'height: 1.2em; font-weight: bold; margin: 0 12px;'">
<li>0</li>
<li>0:20</li>
<li>0:40</li>
<li>1:00</li>
<li>1:20</li>
<li>1:40</li>
<li>2:00</li>
</ol>
<div data-dojo-type="dijit.form.HorizontalRule"
data-dojo-props="
container: 'topDecoration',
count: 7,
style: 'height: 5px; margin: 0 12px;'">
</div>
<input id="hslider" value="60" type="range"
data-dojo-type="dijit.form.HorizontalSlider"
data-dojo-props="
minimum: 0,
maximum: 120,
showButtons: false,
discreteValues: 25">
<div style="padding-top: 10px; text-align: center;">Travel time: <strong id="decValue"></strong> Seconds</div>
<br><br>
<label class="form_col" for="NumberPC">Please Enter a Number of Patrol Car:</label>
<input name="NumberPC" id="NumberPC" type="text" size="10" />
<br><br>
<label class="form_col" for="zone">Zone :</label>
<select name="zone" id="zone">
<option value="none">Select your zone</option>
<option value="z1">zone 1</option>
<option value="z2">zone 2</option>
<option value="z3">zone 3</option>
</select>
<br><br>
<button onclick="AddDTP();">Dispatch</button>
<button onclick="ClearDTP();">Clear Dispatch</button>
</div>
</div>
<div id="map" dojotype="dijit.layout.ContentPane" data-dojo-props="region:'center'"></div>
</div>
</body>
</html>
Thanks a lot for your support.
- Mark as New
- Bookmark
- Subscribe
- Mute
- Subscribe to RSS Feed
- Permalink
Each polygon graphic is having attributes information that gives the FacilityID. Which is nothing but the id of the point that you are adding in the facilities. You can add attribute information in point and use that to query it's polygon.
Thanks,
Mahtab
- Mark as New
- Bookmark
- Subscribe
- Mute
- Subscribe to RSS Feed
- Permalink
Thank you for you replay
But can i check if two polygon (Drive time polygon) intersect if i use point ID?
- Mark as New
- Bookmark
- Subscribe
- Mute
- Subscribe to RSS Feed
- Permalink
Check this reference - Working with Objects
In Javascript you can just add your ID property to each graphic as you are adding them to your map:
        var id = 0;

        dojo.forEach(solveResult.serviceAreaPolygons, function(serviceArea){

          // Add a custom id property and value:
          serviceArea.customId = id;
          id += 1; // increment the ID value

          serviceArea.setSymbol(polygonSymbol);
          map.graphics.add(serviceArea);
        });
If you log the results to the console you can see your new property values:
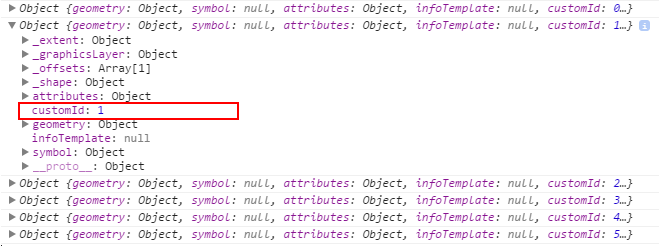
Just make sure not use existing object property names for your new property.
- Mark as New
- Bookmark
- Subscribe
- Mute
- Subscribe to RSS Feed
- Permalink
Dear Mr Owen,
Thank you very much for your replay.
Your answer is very helpful. Can i have a control of that Polygon Id because i have to keep only points when polygon do not intersect.
Exemple
I will keep the first point polygon and add the second one if the polygon of the second one intersect with the first one i delete the second one and go to the other one.
Now in the console i am having the same result but i don't know if i can do intersect query on that polygon ?
- Mark as New
- Bookmark
- Subscribe
- Mute
- Subscribe to RSS Feed
- Permalink
In regards to the custom polygon id value - you have full control over the name of the property and its value.
To do an intersect query on the polygon you would need to use a GeometryService.
Then you can use the intersect() method to test if the polygons overlap. If you just want the combined area of all polygons then you could use the union() method.
You would need to pass in each serviceArea.geometry to the intersect or union methods.
- Mark as New
- Bookmark
- Subscribe
- Mute
- Subscribe to RSS Feed
- Permalink
Sorry for the delay of my answer i was sick 
I am already using a geometry service, and now i know that each polygon have a Id.
What i want to do is to keep the first polygon and check the second one if it intersect with the first one i will keep it otherwise i will delete that polygon and go to the next one.
This task i really don't know how to proceed if some you can help i will be very greatfull
- Mark as New
- Bookmark
- Subscribe
- Mute
- Subscribe to RSS Feed
- Permalink
Dear Owen,
I tried this code to verify if two polygons intersect or not?
I changed this part dojo.forEach(solveResult.serviceAreaPolygons, function(serviceArea){ by the code below.
It's not working you can have a look on it please.
var polys = solveResult.serviceAreaPolygons;
for(var i=0; i<polys.length; i++)
{
// Collect point of the first polygon from the feature list
pointPoly = features[polys["attributes"]["facilityId"] - 1]
for(var j=i+1; j<polys.length; j++)
{
// Verify if the polygon polys
var test = intersect(polys
function intersectionPolygons(polys
{
// if yes
if(test = true)
{
// Deleate the polygon from the list
polys.splice(j,1);
// Reduce the values due to size change in the index table
j--;
i--;
}
}
// else go to the next iteration
}
}
I really need it urgent thanks a lot for your support
- Mark as New
- Bookmark
- Subscribe
- Mute
- Subscribe to RSS Feed
- Permalink
Below the new code i create but still not working
<!DOCTYPE html>
<html>
<head>
<meta http-equiv="Content-Type" content="text/html; charset=utf-8">
<meta http-equiv="X-UA-Compatible" content="IE=7, IE=9, IE=10">
<!--The viewport meta tag is used to improve the presentation and behavior of the samples
on iOS devices-->
<meta name="viewport" content="initial-scale=1, maximum-scale=1,user-scalable=no">
<title>Dispatch Algorithm Implementation</title>
<link rel="stylesheet" href="http://js.arcgis.com/3.9/js/dojo/dijit/themes/claro/claro.css">
<link rel="stylesheet" href="http://js.arcgis.com/3.9/js/esri/css/esri.css">
<style>
body,html,#main{margin:0;padding:0;height:100%;width:100%;}
</style>
<script>var dojoConfig = { parseOnLoad: true };</script>
<script src="http://js.arcgis.com/3.9/"></script>
<script>
dojo.require("esri.map");
dojo.require("esri.tasks.servicearea");
dojo.require("dijit.dijit");
dojo.require("dijit.layout.BorderContainer");
dojo.require("dijit.layout.ContentPane");
dojo.require("dijit.form.HorizontalSlider");
dojo.require("dijit.form.HorizontalRuleLabels");
dojo.require("dijit.form.HorizontalRule");
dojo.require("dijit.form.Button");
dojo.require("esri.graphic");
dojo.require("esri.tasks.geometry");
dojo.require("esri.layers.graphics");
dojo.require("esri.Color");
var map, serviceAreaTask, params, clickpoint, gsvc;
function init() {
esri.config.defaults.io.proxyUrl = "/proxy";
map = new esri.Map("map", {
basemap: "streets",
center: [-122.447, 37.781],
zoom: 14
});
params = new esri.tasks.ServiceAreaParameters();
params.defaultBreaks= [1];
params.outSpatialReference = map.spatialReference;
params.returnFacilities = true;
serviceAreaTask = new esri.tasks.ServiceAreaTask("http://sampleserver3.arcgisonline.com/ArcGIS/rest/services/Network/USA/NAServer/Service Area");
gsvc = new esri.tasks.GeometryService("http://tasks.arcgisonline.com/ArcGIS/rest/services/Geometry/GeometryServer");
dojo.connect(dijit.byId("hslider"), "onChange", updateHorizontalLabel);
updateHorizontalLabel();
}
// Create function that updates label when changed
function updateHorizontalLabel() {
// Get access to nodes/widgets we need to get/set values
var hSlider = dijit.byId("hslider");
var label = dojo.byId("decValue");
// Update label
label.innerHTML = hSlider.get("value");
params.defaultBreaks = [hSlider.value/60];
// if (typeof clickpoint != 'undefined') {
// AddDT(clickpoint);
// };
}
//Clears DTP
function ClearDTP() {
map.graphics.clear();
}
function AddDTP() {
map.graphics.clear(); //clear existing graphics
//define the symbology used to display the results and input point
var pointSymbol = new esri.symbol.PictureMarkerSymbol({
"angle":0,
"xoffset":0,
"yoffset":10,
"type":"esriPMS",
"url":"http://icons.iconarchive.com/icons/aha-soft/standard-transport/256/police-car-icon.png",
"contentType":"image/png",
"width":30,
"height":30
});
var m_mapPoint = [];
m_mapPoint[1] = new esri.geometry.Point([-122.447, 37.781],new esri.SpatialReference({ wkid:4326 }));
m_mapPoint[2] = new esri.geometry.Point([-122.457, 37.791],new esri.SpatialReference({ wkid:4326 }));
m_mapPoint[3] = new esri.geometry.Point([-122.450, 37.785],new esri.SpatialReference({ wkid:4326 }));
m_mapPoint[4] = new esri.geometry.Point([-122.452, 37.775],new esri.SpatialReference({ wkid:4326 }));
m_mapPoint[5] = new esri.geometry.Point([-122.452, 37.791],new esri.SpatialReference({ wkid:4326 }));
m_mapPoint[6] = new esri.geometry.Point([-122.450, 37.777],new esri.SpatialReference({ wkid:4326 }));
var location1 = new esri.Graphic(m_mapPoint[1],pointSymbol);
var location2 = new esri.Graphic(m_mapPoint[2],pointSymbol);
var location3 = new esri.Graphic(m_mapPoint[3],pointSymbol);
var location4 = new esri.Graphic(m_mapPoint[4],pointSymbol);
var location5 = new esri.Graphic(m_mapPoint[5],pointSymbol);
var location6 = new esri.Graphic(m_mapPoint[6],pointSymbol);
map.graphics.add(location1);
map.graphics.add(location2);
map.graphics.add(location3);
map.graphics.add(location4);
map.graphics.add(location5);
map.graphics.add(location6);
var features = [];
features.push(location1);
features.push(location2);
features.push(location3);
features.push(location4);
features.push(location5);
features.push(location6);
var facilities = new esri.tasks.FeatureSet();
facilities.features = features;
params.facilities = facilities;
//solve
serviceAreaTask.solve(params,function(solveResult){
var result = solveResult;
var serviceAreaSymbol = new esri.symbol.SimpleFillSymbol(
esri.symbol.SimpleFillSymbol.STYLE_SOLID,
new esri.symbol.SimpleLineSymbol(
esri.symbol.SimpleLineSymbol.STYLE_SOLID,
new dojo.Color([232,104,80]), 2
),
new dojo.Color([232,104,80,0.25])
);
var polygonSymbol = new esri.symbol.SimpleFillSymbol(esri.symbol.SimpleFillSymbol.STYLE_SOLID, new esri.symbol.SimpleLineSymbol(esri.symbol.SimpleLineSymbol.STYLE_SOLID,
new dojo.Color([232,104,80]), 2),new dojo.Color([232,104,80,0.25]));
/* var id = 0;
dojo.forEach(solveResult.serviceAreaPolygons, function(serviceArea){
// Add a custom id property and value:
serviceArea.customId = id;
id += 1; // increment the ID value
console.log(serviceArea);
// if (serviceArea.FacilityID = 2)
//{
serviceArea.setSymbol(polygonSymbol);
map.graphics.add(serviceArea);
//}
// else {map.graphics.clear(serviceArea);}
}); */
var polys = solveResult.serviceAreaPolygons;
for(var i=0; i<polys.length; i++)
{
// Collect point of the first polygon from the feature list
pointPoly = features[polys["attributes"]["facilityId"] - 1]
for(var j=i+1; j<polys.length; j++)
{
// Verify if the polygon polys
// var test = intersect(polys
function intersectionPolygons()
{
var polysLine = [polys
var pointPolyLine = [pointPoly
var intersectionResult = intersectionLines(polysLine, pointPolyLine);
// if yes
if(intersectResult = true)
{
// Deleate the polygon from the list
polys.splice(j,1);
// Reduce the values due to size change in the index table
j--;
i--;
}
}
// else go to the next iteration
}
}
},function(err){
console.log(err.message);
});
}
dojo.ready(init);
</script>
</head>
<body class="claro">
<div data-dojo-type="dijit.layout.BorderContainer" data-dojo-props="design:'headline', gutters:false" style="width:100%;height:100%;margin:0px;">
<div data-dojo-type="dijit.layout.ContentPane" data-dojo-props="region:'left'">
<b>Choose your threshold to find the appropriate dispatch:</b>
<div style="width: 360px; margin: 10px">
<!-- create rules and labels above horizontal slider -->
<ol data-dojo-type="dijit.form.HorizontalRuleLabels"
data-dojo-props="
container: 'topDecoration',
style: 'height: 1.2em; font-weight: bold; margin: 0 12px;'">
<li>0</li>
<li>0:20</li>
<li>0:40</li>
<li>1:00</li>
<li>1:20</li>
<li>1:40</li>
<li>2:00</li>
</ol>
<div data-dojo-type="dijit.form.HorizontalRule"
data-dojo-props="
container: 'topDecoration',
count: 7,
style: 'height: 5px; margin: 0 12px;'">
</div>
<input id="hslider" value="60" type="range"
data-dojo-type="dijit.form.HorizontalSlider"
data-dojo-props="
minimum: 0,
maximum: 120,
showButtons: false,
discreteValues: 25">
<div style="padding-top: 10px; text-align: center;">Travel time: <strong id="decValue"></strong> Seconds</div>
<br><br>
<label class="form_col" for="NumberPC">Please Enter a Number of Patrol Car:</label>
<input name="NumberPC" id="NumberPC" type="text" size="10" />
<br><br>
<label class="form_col" for="zone">Zone :</label>
<select name="zone" id="zone">
<option value="none">Select your zone</option>
<option value="z1">zone 1</option>
<option value="z2">zone 2</option>
<option value="z3">zone 3</option>
</select>
<br><br>
<button onclick="AddDTP();">Dispatch</button>
<button onclick="ClearDTP();">Clear Dispatch</button>
</div>
</div>
<div id="map" dojotype="dijit.layout.ContentPane" data-dojo-props="region:'center'"></div>
</div>
</body>
</html>
- Mark as New
- Bookmark
- Subscribe
- Mute
- Subscribe to RSS Feed
- Permalink
Sorry for the delay - summer holidays here in Australia 
What is the final outcome that you are after from this process?
If you can outline this using some diagrams it may be easier to figure out how to get the final result.