- Home
- :
- All Communities
- :
- Developers
- :
- JavaScript Maps SDK
- :
- JavaScript Maps SDK Questions
- :
- Re: Adding coordinates to popup / popupTemplate
- Subscribe to RSS Feed
- Mark Topic as New
- Mark Topic as Read
- Float this Topic for Current User
- Bookmark
- Subscribe
- Mute
- Printer Friendly Page
- Mark as New
- Bookmark
- Subscribe
- Mute
- Subscribe to RSS Feed
- Permalink
Working with the 3.22 JS API. Would someone please help me find sample code that adds coordinates ( latitude / longitude ) to a popup when popupTemplate is in use. There are plenty of popup and infoWindow samples which do not use popupTemplate but rather simply call the setContent method.
For the current time I am sticking with popup / popupTemplate rather than infoWindow because the former seems to handle things such as charts, attachments and relationships while I'm not sure that infoWindow handles any of these (feel free to correct me). I am open to changing my approach.
It seems that popup / popupTemplate are called upon map load which makes it tricky to get the coordinates of a click event that occurs well after the map has loaded.
Thank you for any help,
Paul Lohr
Solved! Go to Solution.
Accepted Solutions
- Mark as New
- Bookmark
- Subscribe
- Mute
- Subscribe to RSS Feed
- Permalink
Paul,
Here is a sample that shows how to append the lat and lon to a PopupTemplate:
<!DOCTYPE html>
<html>
<head>
<meta http-equiv="Content-Type" content="text/html; charset=utf-8">
<!--The viewport meta tag is used to improve the presentation and behavior of the samples
on iOS devices-->
<meta name="viewport" content="initial-scale=1, maximum-scale=1,user-scalable=no">
<title>Popup</title>
<link rel="stylesheet" href="http://js.arcgis.com/3.22/dijit/themes/claro/claro.css">
<link rel="stylesheet" href="http://js.arcgis.com/3.22/esri/css/esri.css">
<style>
html, body, #map {
padding: 0;
margin: 0;
height: 100%;
}
/* Change color of icons to match bar chart and selection symbol */
.esriPopup.dark div.titleButton,
.esriPopup.dark div.titlePane .title,
.esriPopup.dark div.actionsPane .action {
color: #A4CE67;
}
/* Additional customizations */
.esriPopup.dark .esriPopupWrapper {
border: none;
}
.esriPopup .contentPane {
text-align: center;
}
.esriViewPopup .gallery {
margin: 0 auto;
}
/*.esriPopup .titleButton.close,
.esriPopup .titleButton.maximize{
display: none;
}*/
</style>
<script src="http://js.arcgis.com/3.22/"></script>
<script>
var map;
require([
"esri/map",
"esri/dijit/Popup", "esri/dijit/PopupTemplate",
"esri/layers/FeatureLayer",
"esri/symbols/SimpleFillSymbol", "esri/Color",
"dojo/dom-class", "dojo/dom-construct", "dojo/on",
"dojox/charting/Chart", "dojox/charting/themes/Dollar",
"dojo/domReady!"
], function(
Map,
Popup, PopupTemplate,
FeatureLayer,
SimpleFillSymbol, Color,
domClass, domConstruct, on,
Chart, theme
) {
//The popup is the default info window so you only need to create the popup and
//assign it to the map if you want to change default properties. Here we are
//noting that the specified title content should display in the header bar
//and providing our own selection symbol for polygons.
var fill = new SimpleFillSymbol("solid", null, new Color("#A4CE67"));
var popup = new Popup({
fillSymbol: fill,
titleInBody: false
}, domConstruct.create("div"));
//Add the dark theme which is customized further in the <style> tag at the top of this page
domClass.add(popup.domNode, "dark");
on(popup,"show,selection-change", addLatLon);
function addLatLon() {
setTimeout(function(){
var node = dojo.query("[dojoattachpoint=\"_description\"]", map.infoWindow.domNode)[0];
var anchor = map.infoWindow.location;
if(node && anchor){
var addStr = "<br><br>Latitude: " + anchor.getLatitude() + ", Longitude: " + anchor.getLongitude();
if(node.innerHTML.indexOf(addStr) < 0){
node.innerHTML += addStr
}
}
}, 50);
}
map = new Map("map", {
basemap: "gray",
center: [-98.57, 39.82],
zoom: 4,
infoWindow: popup
});
var template = new PopupTemplate({
title: "Boston Marathon 2013",
description: "{STATE_NAME}: {Percent_Fi} of starters finished",
fieldInfos: [{ //define field infos so we can specify an alias
fieldName: "Number_Ent",
label: "Entrants"
},{
fieldName: "Number_Sta",
label: "Starters"
},{
fieldName: "Number_Fin",
label: "Finishers"
}],
mediaInfos:[{ //define the bar chart
caption: "",
type:"barchart",
value:{
theme: "Dollar",
fields:["Number_Ent","Number_Sta","Number_Fin"]
}
}]
});
var featureLayer = new FeatureLayer("http://services.arcgis.com/V6ZHFr6zdgNZuVG0/arcgis/rest/services/Boston_Marathon/FeatureServer/0",{
mode: FeatureLayer.MODE_ONDEMAND,
infoTemplate: template
});
map.addLayer(featureLayer);
});
</script>
</head>
<body class="claro">
<div id="map"></div>
</body>
</html>
- Mark as New
- Bookmark
- Subscribe
- Mute
- Subscribe to RSS Feed
- Permalink
That's a nice implementation, but why did you use on.once for the show event? If you close the popup and click another state, the lat/long isn't added. Also, after the first click, the coordinates do not match where you've clicked.
- Mark as New
- Bookmark
- Subscribe
- Mute
- Subscribe to RSS Feed
- Permalink
Ken,
Good catch. I have now fixed the code to correct that mistake.
- Mark as New
- Bookmark
- Subscribe
- Mute
- Subscribe to RSS Feed
- Permalink
Ken,
Once again thanks for catching that. I did not do much testing on this. I now have that issue fixed as well in the original code posted.
- Mark as New
- Bookmark
- Subscribe
- Mute
- Subscribe to RSS Feed
- Permalink
No worries. Like I said, it was a good implementation of working with the dom and illustrating that you can use more than one event in "on".
- Mark as New
- Bookmark
- Subscribe
- Mute
- Subscribe to RSS Feed
- Permalink
This is very helpful, Robert. Thank you for your time and effort in putting this together. Thank you, Ken - for debugging the code.
A follow up question - has anyone tried changing the dojoattachpoint? Best I can tell, changing dojoattachpoint has no effect on where the lat / long values appear in the popup. I changed dojoattachpoint to _gallery (a valid value) then to _bogusValue. In both cases the lat / long values still appear in the _description section.
Thank you,
Paul Lohr
- Mark as New
- Bookmark
- Subscribe
- Mute
- Subscribe to RSS Feed
- Permalink
Paul,
The dojoattchpoint query is get getting a specific html node in the popup. If you look at the other nodes available they are all hidden beside the title node so I am not sure when you are wanting to get a different node.
- Mark as New
- Bookmark
- Subscribe
- Mute
- Subscribe to RSS Feed
- Permalink
Got it, Robert. Thanks again.
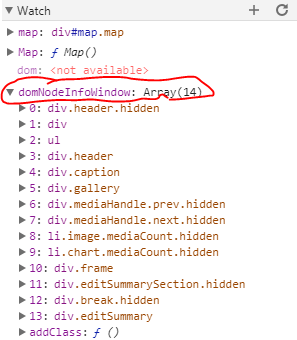
To learn a little about the infoWindow, I removed the array parameter of [1] from domNodeInfoWindow (according to the above code) which allowed me to see that there are other items in the array, similar to _description, that also have an attribute of dojoattachpoint. Setting the dojoattachpoint to _gallery and using the corresponding array value of [5] would seem to make sense but the lat / long value does not appear on the first click. It does appear on the second click. Not a huge problem but a small annoyance. So I went back to using _description and [1], which works well.
This is the modified code which allowed me to look over domNodeInfoWindow:
var domNodeInfoWindow = dojo.query("[dojoattachpoint]=\"_description\"", map1.infoWindow.domNode);
Here are the contents of the domNodeInfoWindow variable (using the modified code above):