- Home
- :
- All Communities
- :
- Developers
- :
- JavaScript Maps SDK
- :
- JavaScript Maps SDK Questions
- :
- Re: Working with TimeSlider outside of supported d...
- Subscribe to RSS Feed
- Mark Topic as New
- Mark Topic as Read
- Float this Topic for Current User
- Bookmark
- Subscribe
- Mute
- Printer Friendly Page
Working with TimeSlider outside of supported date range
- Mark as New
- Bookmark
- Subscribe
- Mute
- Subscribe to RSS Feed
- Permalink
- Report Inappropriate Content
Hi everybody,
I've been working on displaying a multi-dimensional mosaic dataset in a web app with js (which wouldn't have been possible without this forum so far: thank you).
I'm nearly done with everything, but there's one lingering problem:
My dataset intends to show scenarios in five year increments starting at +5 years and going to +100 years (in the future starting from when the user is looking at the data [or intends to implement said scenario]).
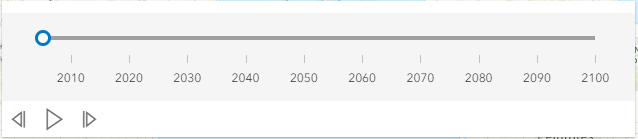
Currently, the date field is set in years and I have added 2000 to each of the scenarios so that TimeSlider would work. So my date slider looks like:

After changing a few things in the CSS, namely:
#timeSlider {
position: absolute;
width: 33%;
left: 33%;
}
.esri-time-slider__time-extent,
.esri-time-slider__min,
.esri-time-slider__max,
.esri-slider__tick.minorTick {
display: none !important;
}
It looks like this:
Just in case, here's the JS used to create TimeSlider:
// create and add time slider to view
const timeSlider = new TimeSlider({
container: 'timeSlider',
mode: 'instant',
view: view
});
view.ui.add(timeSlider, 'manual');
// wait until the layer view is loaded
let timeLayerView;
view.whenLayerView(layer).then(function(layerView) {
timeLayerView = layerView;
const fullTimeExtent = layer.timeInfo.fullTimeExtent;
const start = fullTimeExtent.start;
// set up time slider properties
timeSlider.fullTimeExtent = fullTimeExtent;
timeSlider.values = [start];
timeSlider.stops = {
interval: layer.timeInfo.interval
};
});What I would like is an *animated* slider with labels in 5 year increments starting at 5 and ending at 100.
-------------------------------------------------------------------------------------------------------------------------------------------------------
So the way I see, there would be three ways to 'solve' this problem:
- Somehow hack time-enabled layers and TimeSlider JS to accept values less than 100 as temporal
- Allow TimeSlider to configure user-defined labels
- Use CSS to define labels
Are any of these even possible?
Solved! Go to Solution.
Accepted Solutions
- Mark as New
- Bookmark
- Subscribe
- Mute
- Subscribe to RSS Feed
- Permalink
- Report Inappropriate Content
Hi Gianna,
Here is a copy of your app with the play button working correctly.
https://codepen.io/richiecarmichael/pen/eYNqzyv
The play button's html was incomplete. You were missing some inner components defined in the sample.
Also, because the time to refresh the display is significantly greater than the samples, I switched from requestAnimationFrame to setInterval/clearTimeout.
Hope this helps.
Cheers,
Richie
- Mark as New
- Bookmark
- Subscribe
- Mute
- Subscribe to RSS Feed
- Permalink
- Report Inappropriate Content
Hi Gianna,
TimeSlider is designed to work with dates/times. Have you considered building your own custom slider from Slider?
Thanks,
Richie
- Mark as New
- Bookmark
- Subscribe
- Mute
- Subscribe to RSS Feed
- Permalink
- Report Inappropriate Content
Hi Richie,
Thanks for the reply. Seeing as this might be the only way forward, I've built a custom slider to deal with my unconventional dates. However, I have a problem when trying to animate the slider.
I'm trying to replicate the two examples available (Animate color visual variables and Animate opacity visual variable) but havent quite gotten it yet.
Here's a codepen with my work so far.
(just a note that codepen does something funky with my layout and elements - so it's not exactly what it gonna look like)
(also another note that I have another slider which chooses scenarios which I do not want to animate)
Can you help me hooking up the playButton with yearSlider?
- Mark as New
- Bookmark
- Subscribe
- Mute
- Subscribe to RSS Feed
- Permalink
- Report Inappropriate Content
Hi Gianna,
Here is a copy of your app with the play button working correctly.
https://codepen.io/richiecarmichael/pen/eYNqzyv
The play button's html was incomplete. You were missing some inner components defined in the sample.
Also, because the time to refresh the display is significantly greater than the samples, I switched from requestAnimationFrame to setInterval/clearTimeout.
Hope this helps.
Cheers,
Richie
- Mark as New
- Bookmark
- Subscribe
- Mute
- Subscribe to RSS Feed
- Permalink
- Report Inappropriate Content
Hi Richie,
That's the ticket! Thank you so much for your help. I'm massively grateful.
Cheers,
Gianna