- Home
- :
- All Communities
- :
- Developers
- :
- JavaScript Maps SDK
- :
- JavaScript Maps SDK Questions
- :
- Re: Want to Keep Feature Layer Invisible, but Grap...
- Subscribe to RSS Feed
- Mark Topic as New
- Mark Topic as Read
- Float this Topic for Current User
- Bookmark
- Subscribe
- Mute
- Printer Friendly Page
Want to Keep Feature Layer Invisible, but Graphic Layer Visible, It disappears when FL is set to Visible: False
- Mark as New
- Bookmark
- Subscribe
- Mute
- Subscribe to RSS Feed
- Permalink
Good morning. I have a working app, but I have running into an issue with the graphics. I have the app set up, where the user can make a number of picks (draw points) on the map until they are ready to submit (applyEdits) to the feature layer. Right now, I use the standard map graphics layer and clear the graphic each time the user makes a click on the map. I do not want to display the graphic each time the user makes a pick, only have it display as they make an individual pick.
Now for the tricky part. After the user makes their final pick and decides to submit, I want the graphics to remain on the map until the application closes. To do this, I have set up a Graphics layer, The problem is, when I pass in the geometry (feature), the graphic displays as I want, but only if the Feature Layer is set to Visible: True. I need the Feature Layer to remain Visible: False, since the data will be sensitive to the Public. When the Feature Layer is set to Visible: False, The graphics layers becomes hidden as well.
So in short, how can I have the feature layer where the visibility is set to false, yet have the Graphics layer display?
Below are samples of my work flow and some code:
1. Drawing the Point and submitting after 3 picks (the third pick is the point I want to submit)
Buttons used to perform draw and submit

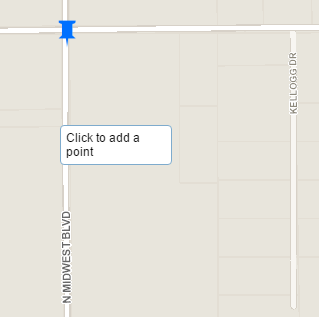
Performing a Draw using the Draw Hot Spot 1. On the third pick, I want to submit. The graphic is cleared as I want. Notice how the graphic disappears each time it is re-drawn. I want this to occur by design.
Pick 1
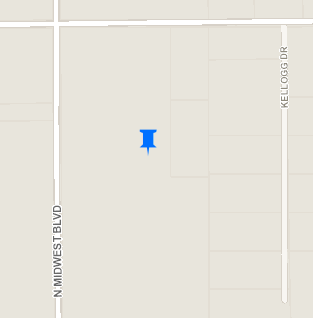
Pick 2
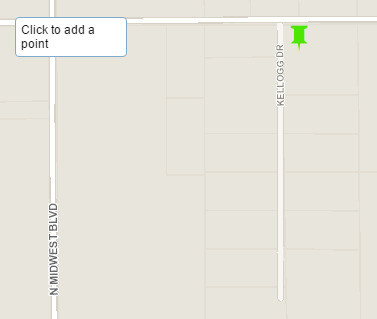
Pick 3

When hitting the Submit Hot Spot Button, it posts to the feature layer with an alert.
Now when going to Draw Hot Spot 2, notice how a new graphic is drawn, but the blue pushpin disappears. This is what I do not want.
Now for the code:
Graphics Layer:
// Symbols - Picture Marker Symbols
symbol1 = new PictureMarkerSymbol('http://gis.edmondok.com/tfstudy/graphics/pushpin_blue.png', 30, 30);
symbol2 = new PictureMarkerSymbol('http://gis.edmondok.com/tfstudy/graphics/pushpin_green.png', 30, 30);
symbol3 = new PictureMarkerSymbol('http://gis.edmondok.com/tfstudy/graphics/pushpin_red.png', 30, 30);
// Graphics Layers with Picture Symbols
var symbol1GraphicsLayer = new GraphicsLayer();
var symbol2GraphicsLayer = new GraphicsLayer();
var symbol3GraphicsLayer = new GraphicsLayer();
Feature Layer:
// Feature Layers
// 01. Traffic Intersections 1
//var trafficInt1 = new FeatureLayer("http://services6.arcgis.com/rCwK7cyJnCFF9MvM/arcgis/rest/services/TrafficIntersections/FeatureServer...", {
var trafficInt1 = new FeatureLayer("https://sampleserver6.arcgisonline.com/arcgis/rest/services/Military/FeatureServer/6", {
mode: FeatureLayer.MODE_SNAPSHOT,
visible: false,
outFields: ["*"]
});
Draw and Editing
// Create Draw and Edit Toolbars 1
function createToolbar1() {
drawToolbar1 = new Draw(map);
editToolbar1 = new Edit(map);
drawToolbar1.on("draw-complete", addGraphicToMap1);
}
function addGraphicToMap1(evt) {
map.graphics.clear();
newAttributes1 = {"direction": "1"};
newFeature1 = new Graphic(evt.geometry, null, newAttributes1);
value1 = map.graphics.add(new Graphic(evt.geometry, symbol1, newAttributes1));
console.log("Graphic geometry for Hot Spot 1 is: ", value1);
}
function addGraphicToTrafficInt1(evt) {
value4 = trafficInt1.applyEdits([newFeature1], null, null);
console.log("Graphic Applied to Feature Layer (0)", value4)
// Graphics Layer and Adding Geometry
newFeature1.setSymbol(symbol1);
symbol1GraphicsLayer.add(newFeature1);
map.addLayer(symbol1GraphicsLayer);
alert("You have successfully added Hot Spot 1")
drawToolbar1.deactivate();
editToolbar1.deactivate();
registry.byId("Point1").on("click", function editDisconnect1(){
drawToolbar1.deactivate();
editToolbar1.deactivate();
alert("Hot Spot 1 has already been added.")
});
dojo.disconnect(handle4);
};
Anyone have any ideas? As always, thanks for the feedback.
- Mark as New
- Bookmark
- Subscribe
- Mute
- Subscribe to RSS Feed
- Permalink
Make sure graphic/feature only exists in one layer. If you want to 'move' it to a different layer you should first clone it, and you can use the toJson() method to help in this task.
var newGraphic = new Graphic(oldGraphic.toJson());- Mark as New
- Bookmark
- Subscribe
- Mute
- Subscribe to RSS Feed
- Permalink
John, I am still having some issues. Not sure how to clone a graphic. I can get the graphics layer to draw and stick, but when changing the map extent, it will vanish. Here is my current code:
// ***********************************************************************
// * Traffic Intersection 2 - Draw/Edit Tool Operations *
// ***********************************************************************
// Activate Draw Toolbar 2
function activateTool2() {
drawToolbar2.activate(Draw.POINT);
}
// Create Draw and Edit Toolbars 2
function createToolbar2() {
drawToolbar2 = new Draw(map);
editToolbar2 = new Edit(map);
drawToolbar2.on("draw-complete", addGraphicToMap2);
}
function addGraphicToMap2(evt) {
map.graphics.clear();
newAttributes2 = {"Editor": "HS2"};
newFeature2 = new Graphic(evt.geometry, null, newAttributes2);
// Adding the Geometry with Symbol to the Graphic Layer 2
symbol2GraphicsLayer.add(newFeature2, symbol2);
// Adds Graphic Layer to the Map 2
map.addLayer(symbol2GraphicsLayer);
value2 = map.graphics.add(new Graphic(evt.geometry, symbol2, newAttributes2));
console.log("Graphic geometry for Hot Spot 2: ", value2);
}
function addGraphicToTrafficInt2(evt) {
value5 = trafficInt2.applyEdits([newFeature2], null, null);
console.log("Graphic Applied to Feature Layer (1)", value5)
// Setting the Symbol and the Graphic to the Graphic Layer 2
newFeature2.setSymbol(symbol2);
symbol2GraphicsLayer.add(newFeature2);
alert("You have successfully added Hot Spot 2")
drawToolbar2.deactivate();
editToolbar2.deactivate();
registry.byId("Point2").on("click", function editDisconnect2(){
drawToolbar2.deactivate();
editToolbar2.deactivate();
alert("Hot Spot 2 has already been added.")
});
dojo.disconnect(handle5);
};
// ***********************************************************************
// * Traffic Intersection 3 - Draw/Edit Tool Operations *
// ***********************************************************************
// Activate Draw Toolbar 3
function activateTool3() {
drawToolbar3.activate(Draw.POINT);
}
// Create Draw and Edit Toolbars 3
function createToolbar3() {
drawToolbar3 = new Draw(map);
editToolbar3 = new Edit(map);
drawToolbar3.on("draw-complete", addGraphicToMap3);
}
function addGraphicToMap3(evt) {
map.graphics.clear();
newAttributes3 = {"Editor": "3"};
newFeature3 = new Graphic(evt.geometry, null, newAttributes3);
// Setting the Symbol and the Graphic to the Graphic Layer 3
symbol3GraphicsLayer.add(newFeature3, symbol3);
// Adds Graphic Layer to the Map 3
map.addLayer(symbol3GraphicsLayer);
value3 = map.graphics.add(new Graphic(evt.geometry, symbol3, newAttributes3));
console.log("Graphic geometry for Hot Spot 3 is: ", value3);
}
function addGraphicToTrafficInt3(evt) {
value6 = trafficInt3.applyEdits([newFeature3], null, null);
console.log("Graphic Applied to Feature Layer (2)", value6)
// Setting the Symbol and the Graphic to the Graphic Layer 3
newFeature3.setSymbol(symbol3);
symbol3GraphicsLayer.add(newFeature3);
alert("You have successfully added Hot Spot 3")
drawToolbar3.deactivate();
editToolbar3.deactivate();
registry.byId("Point3").on("click", function editDisconnect3(){
drawToolbar3.deactivate();
editToolbar3.deactivate();
alert("Hot Spot 3 has already been added.")
});
dojo.disconnect(handle6);
};
Also, I can get the graphic layer to stick, but when panning on the map until the graphic disappears from the view, it then disappears.
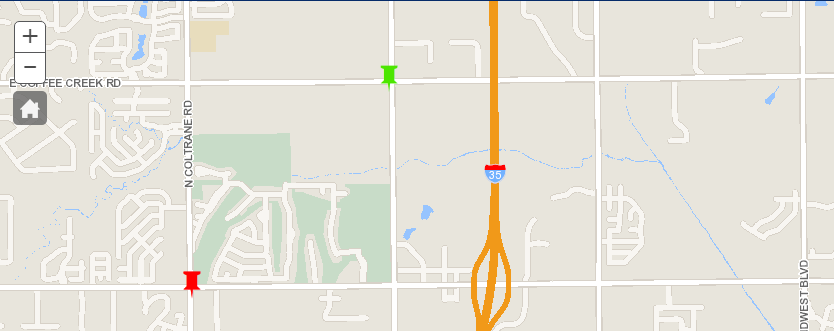
Here is an example of the three graphics layers at once:

And when performing a pan until the blue pushpin is outside of the current view:
Then pan back over and the blue pushpin is gone:

How can I get my graphic layers from disappearing? Only want them to disappear when the map is closed.
This is a tricky one. Thanks for any additional help.