- Home
- :
- All Communities
- :
- Developers
- :
- JavaScript Maps SDK
- :
- JavaScript Maps SDK Questions
- :
- Showing Stack / Bar Charts on Map
- Subscribe to RSS Feed
- Mark Topic as New
- Mark Topic as Read
- Float this Topic for Current User
- Bookmark
- Subscribe
- Mute
- Printer Friendly Page
- Mark as New
- Bookmark
- Subscribe
- Mute
- Subscribe to RSS Feed
- Permalink
Hi, I need to show some stacked/bar chart on a map based on some criteria, as shown here:
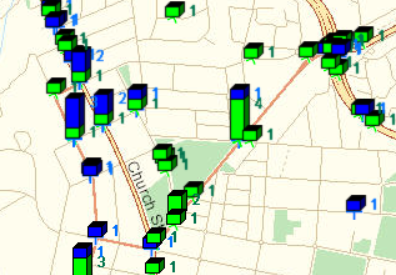
The bar height is the number of overlapping points in the same location. The blue and green colours basically means the type of the overlapping points.
Is there a way to achieve this, whether it's using out-of-box ArcGIS API for JavaScript functionality or some 3rd party library? I haven't been able to find anything.
The sample screenshot shows 3D bars but for now 2D bars can also work.
I am using ArcGIS API for JavaScript 3.22.
Solved! Go to Solution.
Accepted Solutions
- Mark as New
- Bookmark
- Subscribe
- Mute
- Subscribe to RSS Feed
- Permalink
The best approach I found is to dynamically generate the bars as PNG files on the server. The ArcGIS API for JavaScript can then fetch the PNG files and use the usual symbol markers for each point to display the bars.
Another person uses the same approach here: