- Home
- :
- All Communities
- :
- Developers
- :
- JavaScript Maps SDK
- :
- JavaScript Maps SDK Questions
- :
- Polyline not crossing the international dateline
- Subscribe to RSS Feed
- Mark Topic as New
- Mark Topic as Read
- Float this Topic for Current User
- Bookmark
- Subscribe
- Mute
- Printer Friendly Page
Polyline not crossing the international dateline
- Mark as New
- Bookmark
- Subscribe
- Mute
- Subscribe to RSS Feed
- Permalink
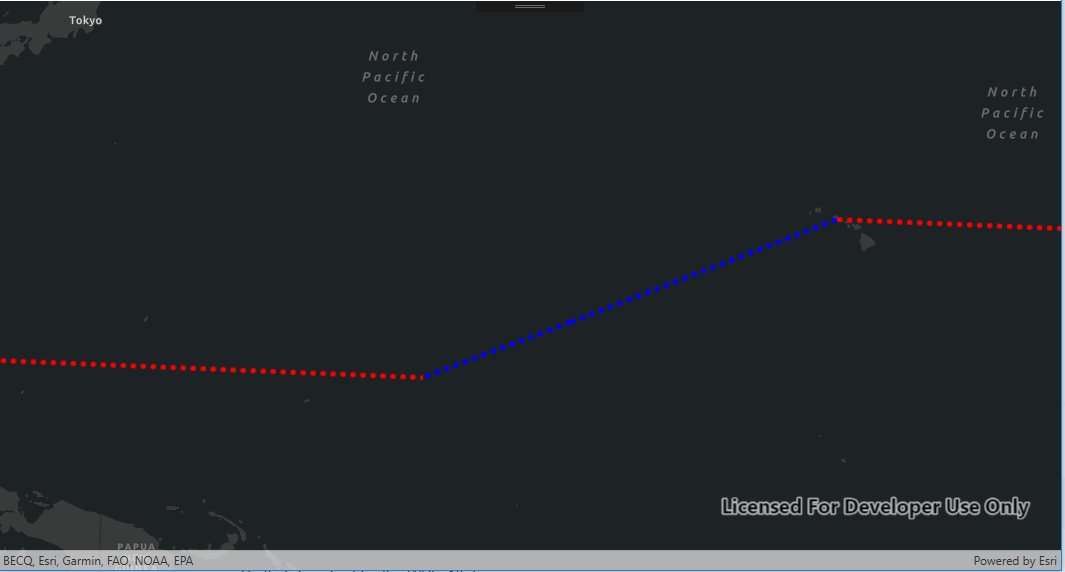
I posted the original question about a WPF .NET Application not crossing the international dateline, https://community.esri.com/thread/237169-polyline-not-crossing-international-dateline. When taking that same solution, of adding or subtracting 360 based on the polyline direction, the ESRI Javascript API v4.12 still stops at the International Dateline.
WPF .NET app (See the blue line below)

Using the ESRI Javascript API v4.12, the fix stops drawing the line at the International dateline.

I was just curious why with .NET the fix works but not with Javascript. And what is the fix for javascript?
Thanks for your help.
Solved! Go to Solution.
Accepted Solutions
- Mark as New
- Bookmark
- Subscribe
- Mute
- Subscribe to RSS Feed
- Permalink
Sorry ignore the previous jsbin and try this one: https://jsbin.com/xegicih/2/edit?html,output.
- Mark as New
- Bookmark
- Subscribe
- Mute
- Subscribe to RSS Feed
- Permalink
This thread might be of some help. https://community.esri.com/thread/230605-how-do-i-remove-the-180th-meridian-line-on-my-map-of-russia
- Mark as New
- Bookmark
- Subscribe
- Mute
- Subscribe to RSS Feed
- Permalink
Also take a look at this JS API 4.12 example that uses geodesicUtils.geodesicDensify() https://codepen.io/andygup/pen/QeyerP.
- Mark as New
- Bookmark
- Subscribe
- Mute
- Subscribe to RSS Feed
- Permalink
Hi Andy,
Thanks for the response. I took your code and added in a Feature layer with a simple line renderer and that does not cross the international dateline. Are we doing something wrong with constructing the graphics for the feature layer? Here is an image (Graphics layer is Orange, Feature Layer is Blue):

Here is the code:
<!DOCTYPE html>
<html>
<head>
<meta charset="utf-8" />
<meta
name="viewport"
content="initial-scale=1,maximum-scale=1,user-scalable=no"
/>
<title>Intro to graphics - 4.12</title>
<link
rel="stylesheet"
href="https://js.arcgis.com/4.12/esri/themes/light/main.css"
/>
<script src="https://js.arcgis.com/4.12/"></script>
<style>
html,
body,
#viewDiv {
padding: 0;
margin: 0;
height: 100%;
width: 100%;
}
</style>
<script>
require([
"esri/Map",
"esri/views/MapView",
"esri/Graphic",
"esri/geometry/Polyline",
"esri/geometry/support/geodesicUtils",
"esri/layers/FeatureLayer",
"esri/symbols/SimpleLineSymbol"],
(
Map,
MapView,
Graphic, Polyline, geodesicUtils, FeatureLayer, SimpleLineSymbol
) => {
var map = new Map({
basemap: "hybrid"
});
var view = new MapView({
center: [-80, 35],
container: "viewDiv",
map: map,
zoom: 2
});
/****************************
* Create a polyline graphic
****************************/
// First create a line geometry (this is the Keystone pipeline)
var polyline = new Polyline({
// paths: [[138, 36], [-98, 49.5], [-118, 34], [-155.5828, //19.8968], [138, 36]]
paths: [[-157.945774, 21.339723],
[167.726017, 8.719545]]
});
// Create a symbol for drawing the line
var lineSymbol = {
type: "simple-line", // autocasts as SimpleLineSymbol()
color: [226, 119, 40],
width: 4
};
let g1 = null;
let geom = geodesicUtils.geodesicDensify(polyline, 100000);
g1 = new Graphic({
geometry: geom,
symbol: lineSymbol
})
view.graphics.addMany([g1]);
var CircuitInfo = [];
CircuitInfo.push({
Name: "Hickam AFB to/from Kwajalein Atoll, RMI",
Site1: "Hickam AFB",
lat: 21.339723,
lng: -157.945774,
Site2: "Kwajalein Atoll, RMI",
Site2Lat: 8.719545,
Site2Long: 167.726017,
SiteType: "COI"
});
var circuitGraphics = CircuitInfo.map((item, i) => new Graphic({
geometry:
geodesicUtils.geodesicDensify(new Polyline({
paths: [
[item.lng, item.lat],
[item.Site2Long, item.Site2Lat]
]
}), 100000),
attributes: {
ObjectID: i++,
Name: item.Name,
Description: item.Description,
SiteType: item.SiteType
}
}));
const fields = [
{
name: "ObjectID",
alias: "ObjectID",
type: "oid"
},
{
name: "Name",
alias: "Name",
type: "string"
},
{
name: "SiteType",
alias: "Location Type",
type: "string"
}
];
var lineRenderer = {
type: "simple",
symbol: new SimpleLineSymbol({
color: "blue",
width: 10
})
};
var eventCircuitslayer = new FeatureLayer({
source: circuitGraphics, // autocast as an array of esri/Graphic
objectIdField: "ObjectID", // This must be defined when creating a layer from Graphics
fields: fields,
renderer: lineRenderer,
title: "Wrap Problem",
//spatialReference: { wkid: 3857 }
});
map.add(eventCircuitslayer);
});
</script>
</head>
<body>
<div id="viewDiv"></div>
</body>
</html>
Thanks for your help so far.
~Alan
- Mark as New
- Bookmark
- Subscribe
- Mute
- Subscribe to RSS Feed
- Permalink
Hi Alan, thanks for the code. That's a bug and I've opened an issue on it. The workaround for 4.12 is to convert to webmercator and then normalize the geometries, for example: FeatureLayer across dateline. Let me know if that doesn't work?
- Mark as New
- Bookmark
- Subscribe
- Mute
- Subscribe to RSS Feed
- Permalink
Hey Andy,
Not sure your workaround works. Looks like the colors were flipped from the code I posted so the Feature layer is now orange and the Graphics layer is now blue. Either way, in your example the Feature Layer is still stopping at the international dateline.
Did I misinterpret the code?
Thanks,
Alan
- Mark as New
- Bookmark
- Subscribe
- Mute
- Subscribe to RSS Feed
- Permalink
Sorry ignore the previous jsbin and try this one: https://jsbin.com/xegicih/2/edit?html,output.
- Mark as New
- Bookmark
- Subscribe
- Mute
- Subscribe to RSS Feed
- Permalink
Thanks Andy, that one works.