- Home
- :
- All Communities
- :
- Developers
- :
- JavaScript Maps SDK
- :
- JavaScript Maps SDK Questions
- :
- Polygon Geometry is not Showing
- Subscribe to RSS Feed
- Mark Topic as New
- Mark Topic as Read
- Float this Topic for Current User
- Bookmark
- Subscribe
- Mute
- Printer Friendly Page
Polygon Geometry is not Showing
- Mark as New
- Bookmark
- Subscribe
- Mute
- Subscribe to RSS Feed
- Permalink
Hi
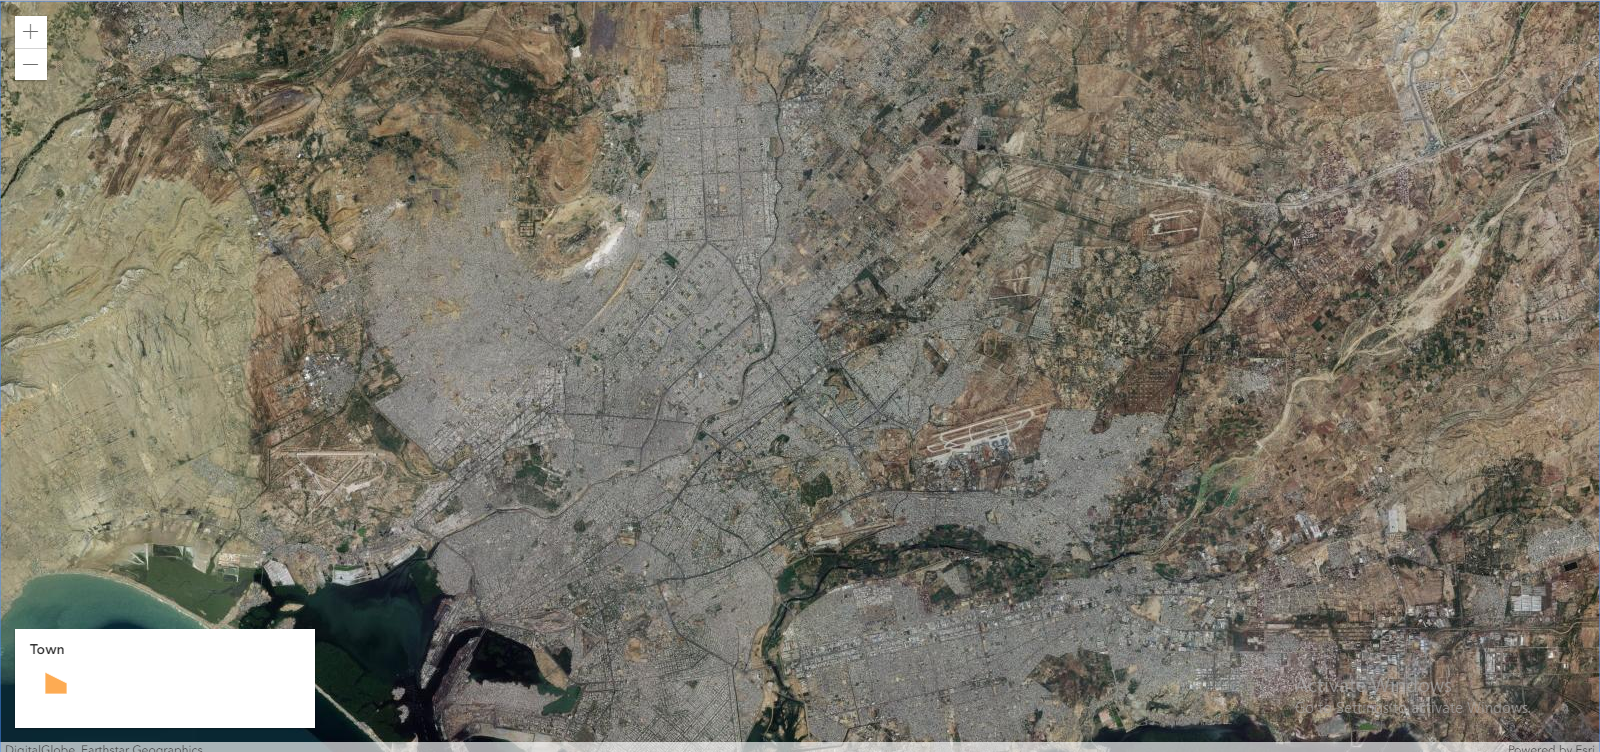
I have created JSON service with Node.js and use it to display polygons on map but Geometry is not showing while Legend is working properly as shown in attached image.
<!DOCTYPE html>
<html>
<head>
<meta charset="utf-8" />
<meta
name="viewport"
content="initial-scale=1,maximum-scale=1,user-scalable=no"
/>
<title>JSON</title>
<style>
html,
body,
#viewDiv {
padding: 0;
margin: 0;
height: 100%;
width: 100%;
}
</style>
<link
rel="stylesheet"
href="https://js.arcgis.com/4.12/esri/themes/light/main.css"
/>
<script src="https://js.arcgis.com/4.12/"></script>
<script>
require([
"esri/Map",
"esri/views/MapView",
"esri/request",
"esri/Graphic",
"esri/geometry/Polygon",
"esri/widgets/Editor",
"esri/widgets/Legend",
"esri/layers/FeatureLayer",
"esri/geometry/projection",
"esri/geometry/SpatialReference"
], function(Map, MapView, esriRequest, Graphic,Polygon,Editor, Legend,FeatureLayer, projection, SpatialReference) {
projection.load()
let url ="http://localhost:7001/polygon"
let myData = []
let fields = [
{
name: "ObjectID",
alias: "ObjectID",
type: "oid"
},
{
name: "CATEGORY",
alias: "CATEGORY",
type: "string"
},
{
name: "TYPE",
alias: "TYPE",
type: "string"
},
{
name: "TOWN",
alias: "TOWN",
type: "string"
},
{
name: "BLOCK_PHASE_SECTOR",
alias: "BLOCK_PHASE_SECTOR",
type: "string"
},
{
name: "STREET",
alias: "STREET",
type: "string"
},
{
name: "DATE",
alias: "DATE",
type: "string"
}
];
let pTemplate = {
title: "{title}",
content: [
{
type: "fields",
fieldInfos: [
{
fieldName: "CATEGORY",
label: "CATEGORY",
visible: true
},
{
fieldName: "TYPE",
label: "TYPE",
visible: true
},
{
fieldName: "TOWN",
label: "TOWN",
visible: true
},
{
fieldName: "BLOCK_PHASE_SECTOR",
label: "BLOCK_PHASE_SECTOR",
visible: true
},
{
fieldName: "STREET",
label: "STREET",
visible: true
},
{
fieldName: "DATE",
label: "DATE",
visible: true,
format: {
digitSeparator: true,
places: 0
}
}
]
}
]
};
let map = new Map({
basemap: "satellite",
});
let view = new MapView({
container: "viewDiv",
center: [67.068037, 24.872328],
zoom: 12,
map: map
});
let options = {
query: {
f: "json"
},
responseType: "json"
};
let fetchData = () => esriRequest(url, options).then(response => response.data)
let webservice = res => {
res.map(function(result, i){
let resultPnts = result.Shape.points.map(function(point){
return new Polygon({
rings:point,
spatialReference : {
wkid: 102100
}
});
})
let atts = {
"ObjectID": i,
"CATEGORY": result.CATEGORY,
"TYPE": result.TYPE,
"TOWN": result.TOWN,
"BLOCK_PHASE_SECTOR": result.BLOCK_PHASE_SECTOR,
"STREET": result.STREET,
"DATE": result.DATE
};
let graArr = resultPnts.map(function(pnt){
//let projectedPoint = projection.project(pnt,view.spatialReference);
let markerSymbol = {
type: "simple-fill", // autocasts as new SimpleFillSymbol()
color: [100, 139, 79],
outline: {
// autocasts as new SimpleLineSymbol()
color: [255, 255, 255],
width: 1
}
};
let g =new Graphic({
geometry:pnt,
symbol: markerSymbol,
attributes: atts
})
myData.push(g)
})
return graArr
})
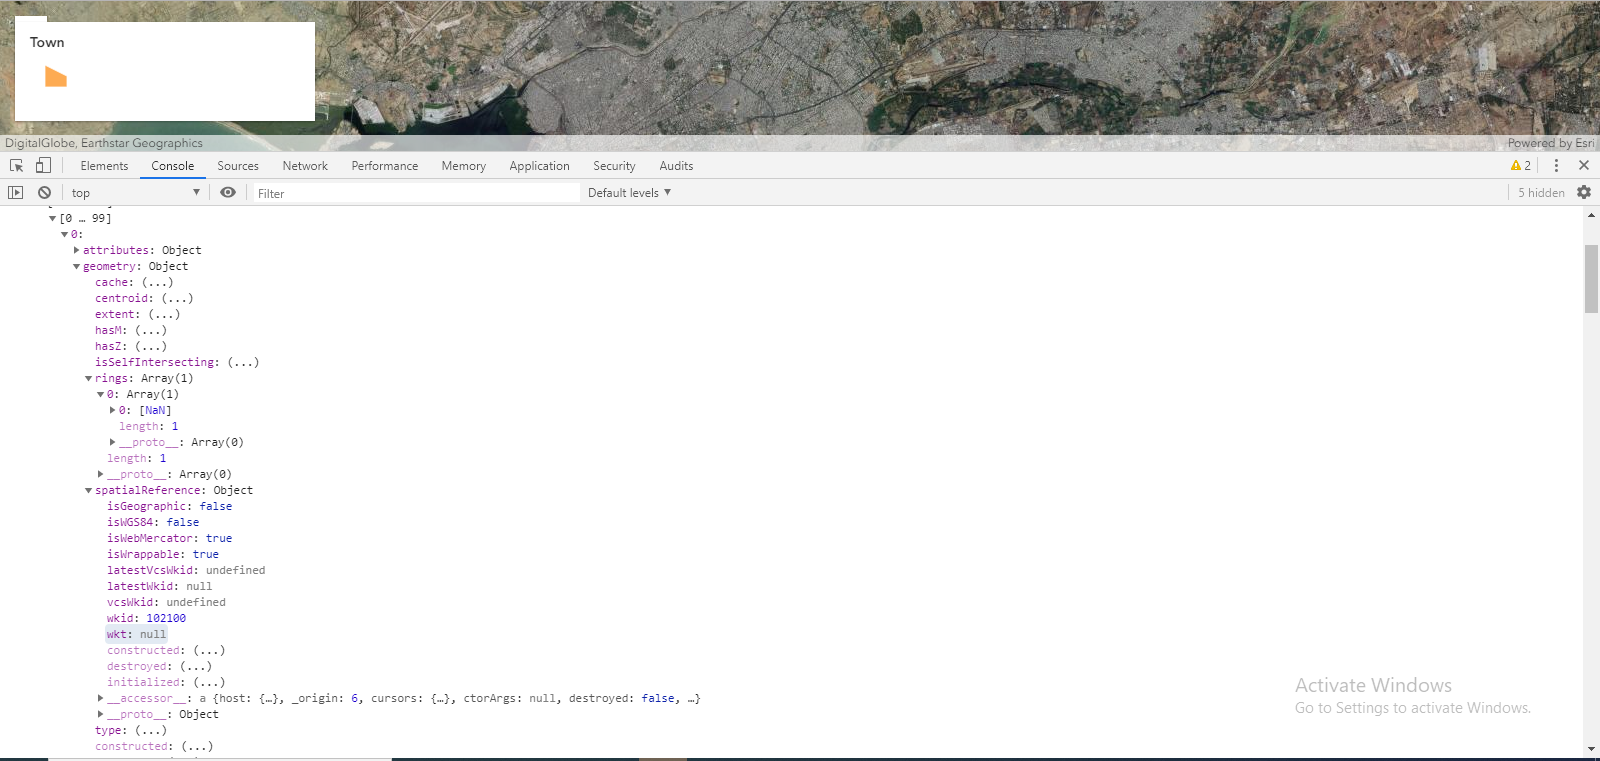
console.log(myData)
let layer = new FeatureLayer({
geometryType: "polygon",
source: myData,
fields: fields,
objectIdField: "ObjectID",
//renderer: dataRenderer,
popupTemplate: pTemplate
});
map.add(layer)
var legend = new Legend({
view: view,
layerInfos: [
{
layer: layer,
title: "Town"
}
]
});
view.ui.add(legend, 'bottom-left')
}
view.when(() =>{
fetchData()
.then(webservice)
view.popup.autoOpenEnabled = true; //disable popups
/* // Create the Editor
let editor = new Editor({
view: view
});
// Add widget to top-right of the view
view.ui.add(editor, "top-right");*/
})
});
</script>
</head>
<body>
<div id="viewDiv"></div>
</body>
</html>- Mark as New
- Bookmark
- Subscribe
- Mute
- Subscribe to RSS Feed
- Permalink
The crux of your issue is displaying geometry which is provided by the JSON service you created. Unfortunately, you haven't provided any information about that service or the geometries it serves up, and GeoNet users can't access the service URL since it is on your local machine. What can you share about the geometry and your JSON service?
- Mark as New
- Bookmark
- Subscribe
- Mute
- Subscribe to RSS Feed
- Permalink
The JSON you uploaded isn't valid GeoJSON or Esri JSON for defining sets of features, which is probably the reason no geometry is being created in your code.
- Mark as New
- Bookmark
- Subscribe
- Mute
- Subscribe to RSS Feed
- Permalink
Joshua
I have Plotted point features with JSON service and the Syntax/Format of point and polygon service is same as i shared polygon service with you.
Here is Question that i asked before https://community.esri.com/thread/240873-use-webservices-with-arcgis-api
Following is sample of my point service.
[
{
"OBJECTID": 146,
"Splitter": "64",
"Comment": "DHA Phase05",
"Name": "Plaza POP ODB 02",
"ID": "2100604",
"Placement": "Aerial",
"POP": 21006,
"Shape": {
"srid": 32642,
"version": 1,
"points": [
{
"x": 301997.6824000003,
"y": 2746232.8489999995,
"z": null,
"m": null
}
],
"figures": [
{
"attribute": 1,
"pointOffset": 0
}
],
"shapes": [
{
"parentOffset": -1,
"figureOffset": 0,
"type": 1
}
],
"segments": []
}
},
{
"OBJECTID": 147,
"Splitter": "64",
"Comment": "DHA Phase06",
"Name": "Badar POP ODB Muhafiz",
"ID": "2100502",
"Placement": "Aerial",
"POP": 21005,
"Shape": {
"srid": 32642,
"version": 1,
"points": [
{
"x": 302831.8328999998,
"y": 2742953.342599999,
"z": null,
"m": null
}
],
"figures": [
{
"attribute": 1,
"pointOffset": 0
}
],
"shapes": [
{
"parentOffset": -1,
"figureOffset": 0,
"type": 1
}
],
"segments": []
}
}
]- Mark as New
- Bookmark
- Subscribe
- Mute
- Subscribe to RSS Feed
- Permalink
In your original code, Lines #157-162 appear to be building (or trying to build) a polygon from a single point, which isn't valid. Also, when looking at your polygon.json file, there appear to be numerous polygons, but your code seems to be treating all the points are a single set of points instead of groups of points.
- Mark as New
- Bookmark
- Subscribe
- Mute
- Subscribe to RSS Feed
- Permalink
Yes you are right but i am confused to loop groups of point in polygon graphic. This code loop single set of points in line #151