- Home
- :
- All Communities
- :
- Developers
- :
- JavaScript Maps SDK
- :
- JavaScript Maps SDK Questions
- :
- Re: JS API 4.18 - Map height increasing non stop
- Subscribe to RSS Feed
- Mark Topic as New
- Mark Topic as Read
- Float this Topic for Current User
- Bookmark
- Subscribe
- Mute
- Printer Friendly Page
- Mark as New
- Bookmark
- Subscribe
- Mute
- Subscribe to RSS Feed
- Permalink
Hi,
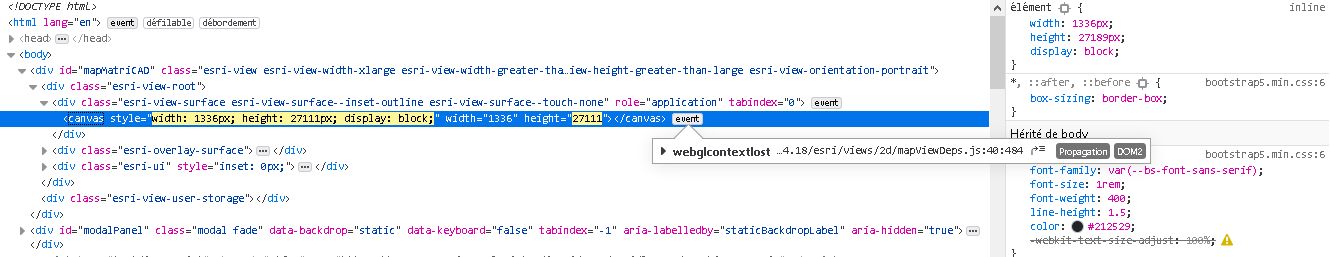
I'm facing a weird issue wich was already existing in js api 3.x : When the app start, the map loads and the inner canvas heigth start to increase non stop (see attachment). Looks like I'm animating an elevator ...
In js api 3.x, @RobErt Scheitlin solves the problem suggesting to set "autoResize" property to false.
In js api 4.x, I don't see any equivalent property. It's the first time I encounter such a problem, dunno how to solve this issue
Here is the code :
In HTML file :
<div id="mapMatriCAD"></div>
In JS file :
// Create a Map instance
const matricadMap = new Map({
basemap: colorBasemap
});// Create a MapView instance (for 2D viewing) and reference the map instance
const matricadMapView = new MapView({
container: "mapMatriCAD",
map: matricadMap,
highlightOptions: {
color: "orange"
}
});// Toggle backgrounds layers
const basemapToggle = new BasemapToggle({
view: matricadMapView,
nextBasemap: aerophotoBasemap
});ready(function () {
/* Set ArcGIS Server proxy URL */
esriConfig.request.proxyUrl = proxyiedUrl;/* Set ArcGIS GeometryService URL */
esriConfig.geometryServiceUrl = 'https://<my-geometry-service>';
// Set map extent
const matricadMapExtent = new Extent({
xmin: 145998.0719999969,
ymin: 162020.52899999917,
xmax: 152430.14699999988,
ymax: 167383.29899999872,
spatialReference: {
wkid: 31370
}
});
matricadMapView.extent = matricadMapExtent;// Set initial zoom
matricadMapView.constraints = {
minScale: 25000
};// Get graphic properties from view click
matricadMapView.on('click', function (event) {
matricadMapView.hitTest(event).then(function (response) {
if (response.results.length) {
debugger;
}
});});
});
Solved! Go to Solution.
Accepted Solutions
- Mark as New
- Bookmark
- Subscribe
- Mute
- Subscribe to RSS Feed
- Permalink
Rene, altough the css was included in the code and correctly loaded, it was not correctly parsed for wathever reason I'm investigating now.
It doesn't appear missing in the dev tools so the debug wasn't showing any problem apparently.
Thanks for showing the way.
- Mark as New
- Bookmark
- Subscribe
- Mute
- Subscribe to RSS Feed
- Permalink
I usually see this happen when you don't have the CSS for the API added to your page, can you verify your CSS version matches the API version.
- Mark as New
- Bookmark
- Subscribe
- Mute
- Subscribe to RSS Feed
- Permalink
Rene, altough the css was included in the code and correctly loaded, it was not correctly parsed for wathever reason I'm investigating now.
It doesn't appear missing in the dev tools so the debug wasn't showing any problem apparently.
Thanks for showing the way.
- Mark as New
- Bookmark
- Subscribe
- Mute
- Subscribe to RSS Feed
- Permalink
There are a lot of things I'm unsure of in this sample. I've included some code below that works, but I've left out the proxy (I don't need it) and the geometry service (you don't need it in this sample piece so not sure why it's there). Also, you can set the initial zoom location and scale through the view initialization, not sure why you have a secondary extent and resolution. I left those out and just relied on the initial View zoom. Also, the coordinates and map projection may not be correct, unless you are looking at the west coast of Africa (usually the first sign you're not). I'm sure there's a lot more to this than what you're showing but this would work (with a good projection) using the code you have provided so far:
<!DOCTYPE html>
<html>
<head>
    <meta charset="utf-8" />
    <title>Testing</title>

    <link rel="stylesheet" href="https://js.arcgis.com/4.18/esri/themes/dark-blue/main.css">
    <script src="https://js.arcgis.com/4.18/"></script>

    <style>
        html,
        body,
        #mapMatriCAD {
            padding: 0;
            margin: 0;
            height: 100%;
            width: 100%;
        }
    </style>

    <script>
        require([
            "esri/Map",
            "esri/layers/FeatureLayer",
            "esri/layers/GraphicsLayer",
            "esri/views/MapView",
            "esri/geometry/Extent",
            "esri/widgets/BasemapToggle"

        ], function (Map, FeatureLayer, GraphicsLayer, MapView, Extent, BasemapToggle
        ) {

            // Create the Map
            const matricadMap = new Map({
                basemap: "topo-vector"
            });

            // Set map extent
            const matricadMapExtent = new Extent({
                xmin: 145998.0719999969,
                ymin: 162020.52899999917,
                xmax: 152430.14699999988,
                ymax: 167383.29899999872,
                spatialReference: {
                    wkid: 31370
                }
            });

            // Create a MapView instance (for 2D viewing) and reference the map instance
            const matricadMapView = new MapView({
                container: "mapMatriCAD",
                map: matricadMap,
                center: matricadMapExtent.center,
                zoom: 9,
                highlightOptions: {
                    color: "orange"
                }
            });

            // Carbon storage of trees in Warren Wilson College.
            var featureLayer = new FeatureLayer({
                url: "https://services.arcgis.com/V6ZHFr6zdgNZuVG0/arcgis/rest/services/Landscape_Trees/FeatureServer/0"
            });

            matricadMap.add(featureLayer);

            // Toggle backgrounds layers
            const basemapToggle = new BasemapToggle({
                view: matricadMapView,
                nextBasemap: "hybrid"
            });

            matricadMapView.when(function () {
                /* Set ArcGIS Server proxy URL */
                //esriConfig.request.proxyUrl = proxyiedUrl;
                /* Set ArcGIS GeometryService URL */
                //esriConfig.geometryServiceUrl = 'https://<my-geometry-service>';

                //matricadMapView.extent = matricadMapExtent;

                // Set initial zoom
                //matricadMapView.constraints = {
                //    minScale: 25000
                //};

                // Get graphic properties from view click
                matricadMapView.on('click', function (event) {
                    matricadMapView.hitTest(event).then(function (response) {
                        if (response.results.length) {
                            console.log(response);
                        }
                    });
                });
            });

        });
    </script>
</head>
<body>
    <div id="mapMatriCAD"></div>
</body>
</html>- Mark as New
- Bookmark
- Subscribe
- Mute
- Subscribe to RSS Feed
- Permalink
Thanks Jeffrey for your help. It was finally a sporadic css parsing issue.
Have a nice day