- Home
- :
- All Communities
- :
- Developers
- :
- JavaScript Maps SDK
- :
- JavaScript Maps SDK Questions
- :
- Hover tooltipFields and JSON data
- Subscribe to RSS Feed
- Mark Topic as New
- Mark Topic as Read
- Float this Topic for Current User
- Bookmark
- Subscribe
- Mute
- Printer Friendly Page
Hover tooltipFields and JSON data
- Mark as New
- Bookmark
- Subscribe
- Mute
- Subscribe to RSS Feed
- Permalink
So I had some major developments towards finding a solution.
I managed to precent a pie-chart and doing so in a dynamic manner regardless of what kind of data I'm working with.
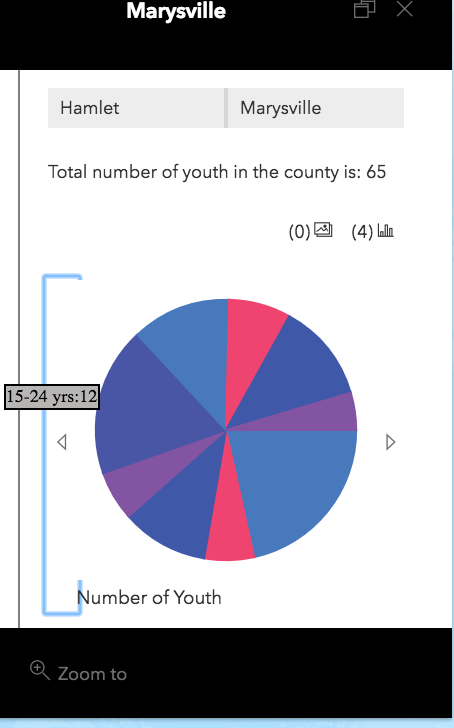
The issue I'm experiencing though in regards to the tooltip when hovering on each one of those slices:
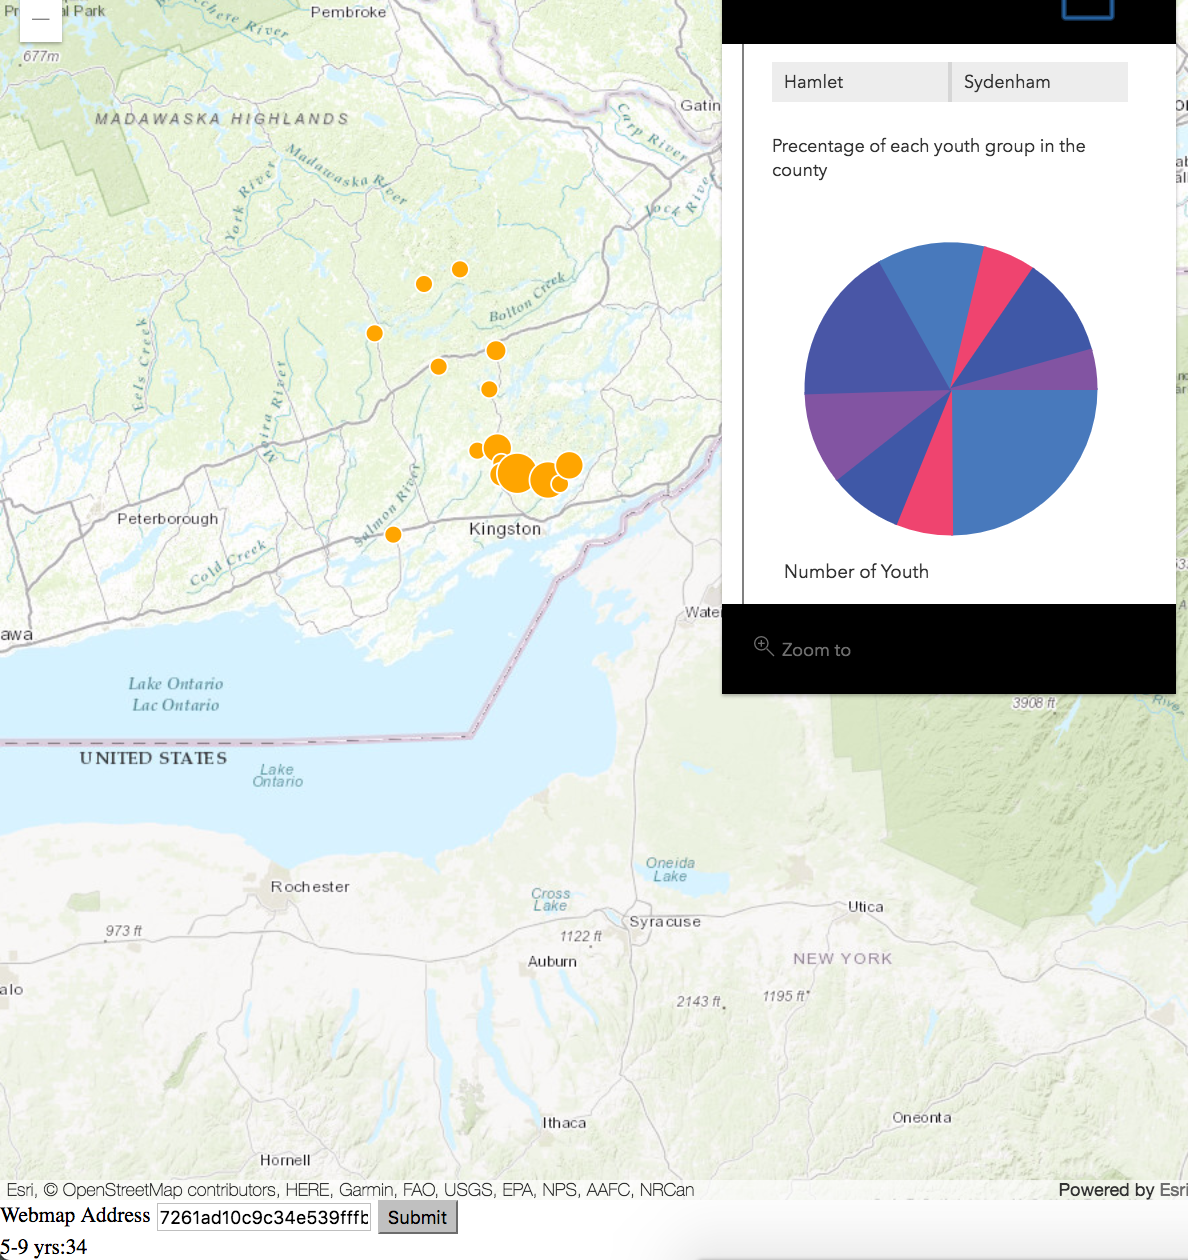
as you can see in the image for some reason whenever I'm hovering on the slices of the pie-chart the data of each of those slices gets presented to at the bottom left corner of this image (5-9 yrs:34) . Instead I would like to have it similar to the way they have it in this example:
ArcGIS API for JavaScript Sandbox
Now understand that they working in their sandbox with hosted layer from their online tool (?), however in my case I'm working with locally fetched data from a JSON file.
This is how my popup tempalate looks like:
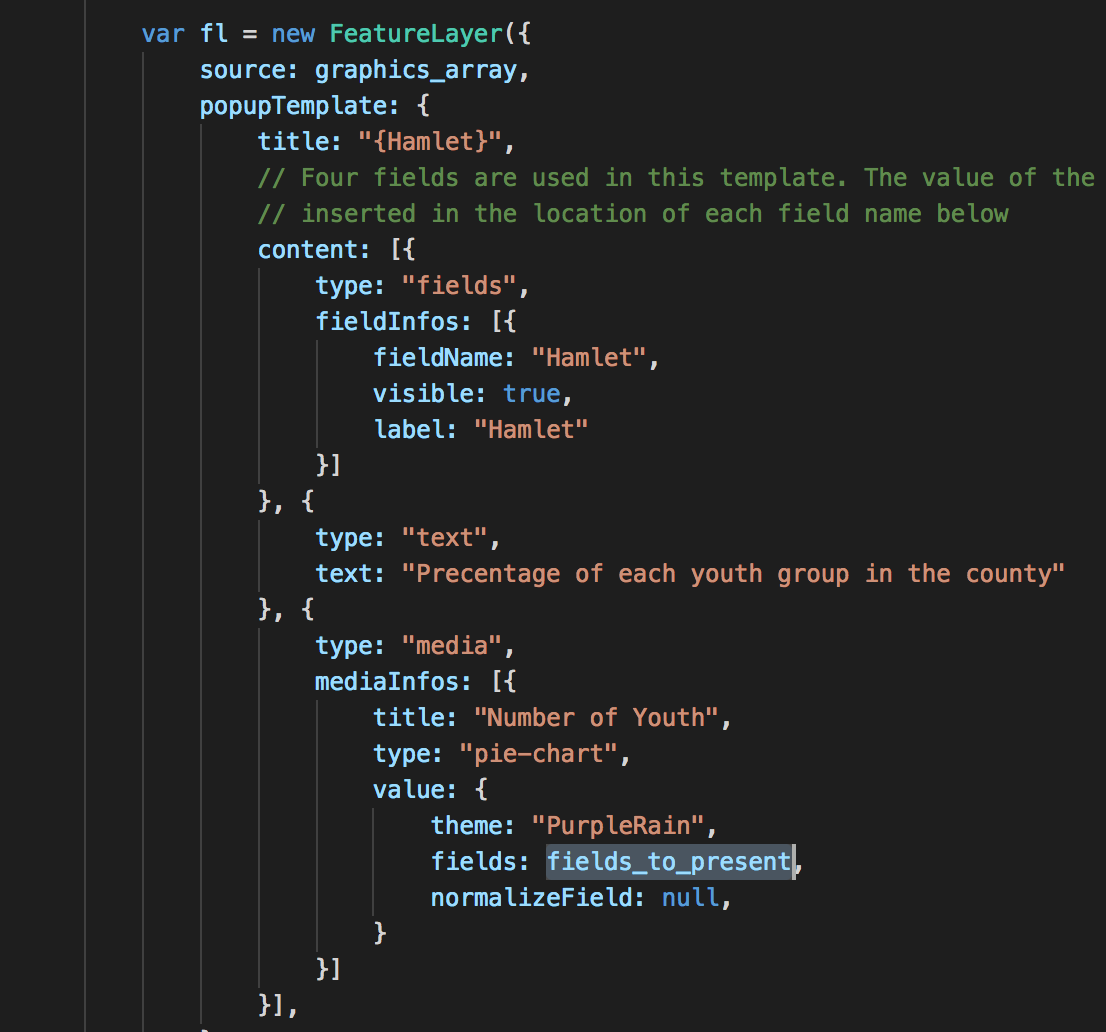
Now I removed the tooltipFields property because it wasn't working at all.
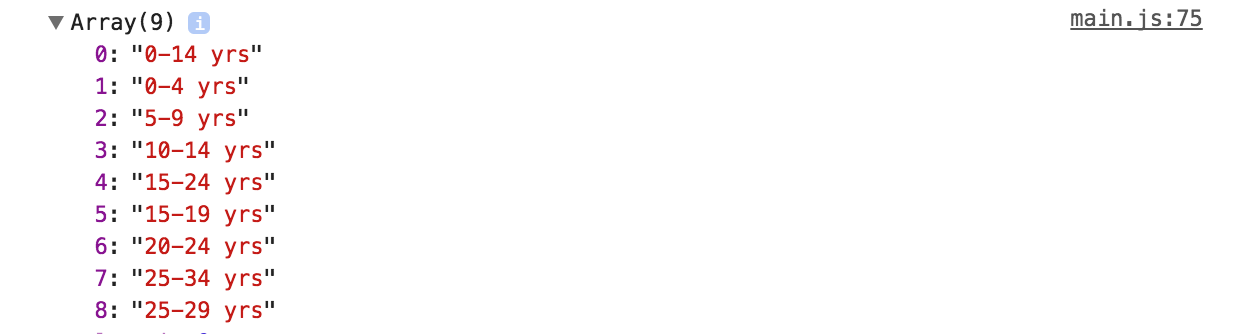
and the fields_to_present array hold the following items:
- Mark as New
- Bookmark
- Subscribe
- Mute
- Subscribe to RSS Feed
- Permalink
Can you add a copy of what your json looks like? Currently it looks like the field you are using for the tooltip is an array with 9 values?
- Mark as New
- Bookmark
- Subscribe
- Mute
- Subscribe to RSS Feed
- Permalink
Hello Kelly,
I managed to show the popup according to the instructions of John Grayson (user below), however now I'm met with the issue of trying to understand how come it shows all the other 9 values
- 0:"0-14 yrs"
- 1:"0-4 yrs"
- 2:"5-9 yrs"
- 3:"10-14 yrs"
- 4:"15-24 yrs"
- 5:"15-19 yrs"
- 6:"20-24 yrs"
- 7:"25-34 yrs"
- 8:"25-29 yrs"
if I only passed one ("0-14 yrs") to the tooltipFields.
I added the JSON below as requested:
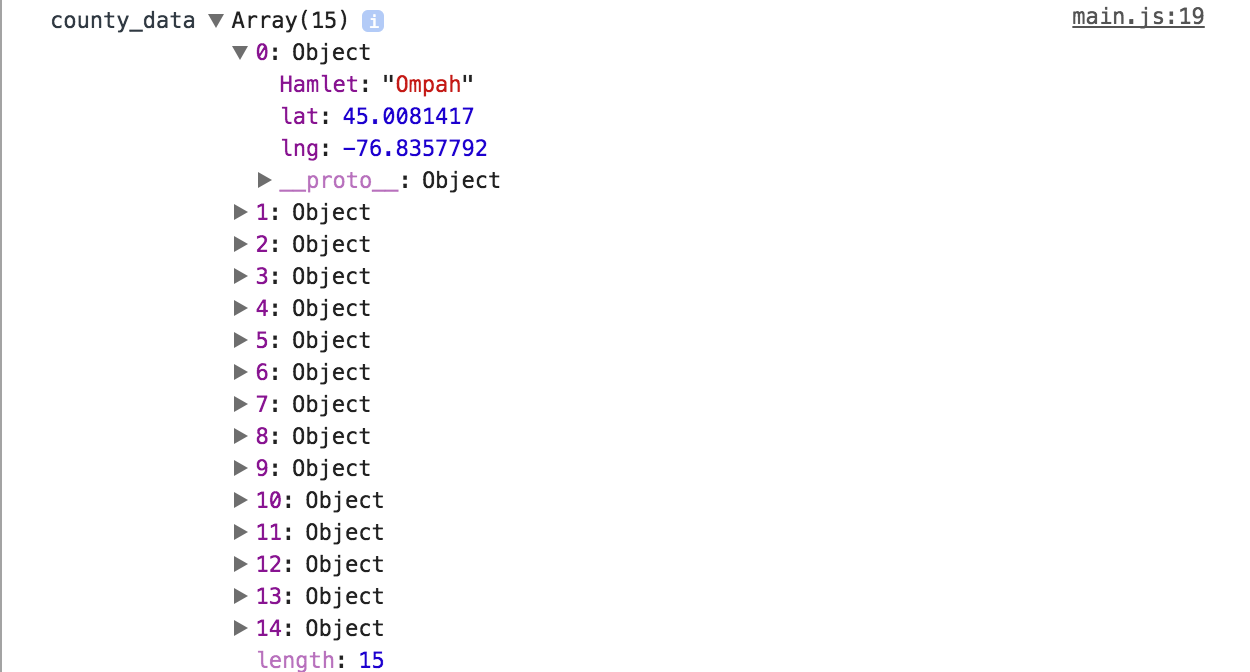
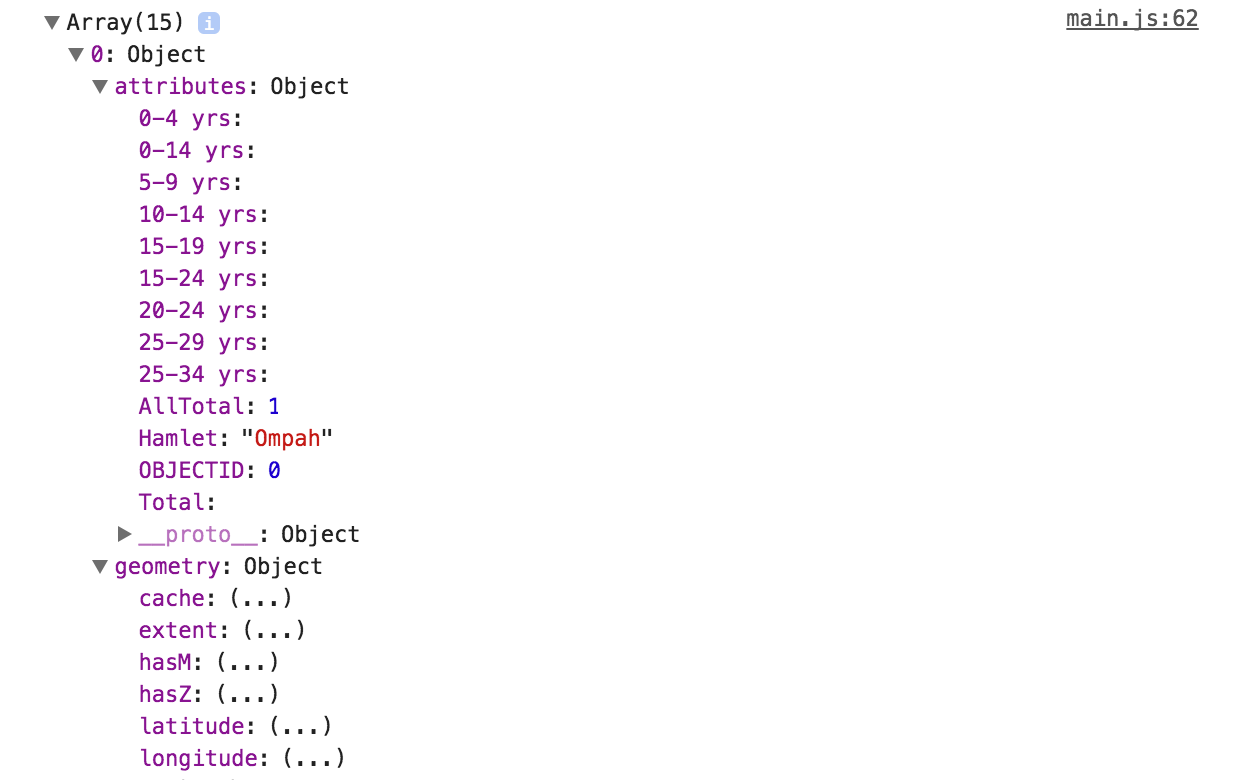
(above) This is how my county data arrives in its pure JSON form (before I restructure it).

(above) This is how my youth demographic data arrives in its pure JSON form.
** I censored the values inside each property, they are not empty
(above) and this is how my data looks after I combined, restructured and converted the JSON arrays into presentable format ready to be consumed by a Featurelayer.
** I censored the values inside each property, they are not empty
Please help me understand this.
P.S:
there is a lot of extra information if need, in my replay to John Grayson.
- Mark as New
- Bookmark
- Subscribe
- Mute
- Subscribe to RSS Feed
- Permalink
So the issue is that the tooltip text is showing up at a different part of the web page? Sounds like a CSS issue... did you include the CSS similar to what is being used in the sample? Do you have a jsbin or similar that shows the problem?
<link rel="stylesheet" href="https://js.arcgis.com/4.4/esri/css/main.css">
<link rel="stylesheet" href="https://js.arcgis.com/4.4/dijit/themes/claro/claro.css">- Mark as New
- Bookmark
- Subscribe
- Mute
- Subscribe to RSS Feed
- Permalink
Hello John,
Thank you very much for the heads up, I can't believe how I could miss the tag at the header, the hover is showing right now properly.
My only question right now ill be is: Why is it showing?
In my code below:
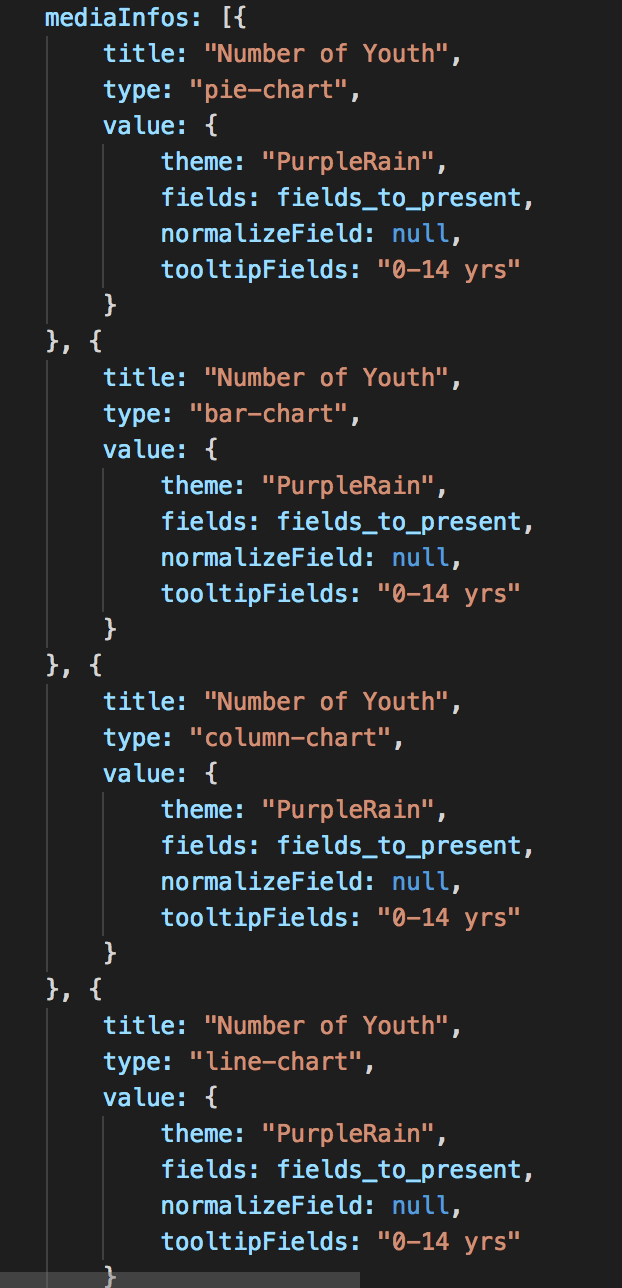
the only field that I have passed to tooltipFields is "0-14 yrs", however when I hover over other slices of the pie it shows the other age range values as well:
did I understand the role of tooltipFields wrongly?
according to the documentation, it is responsible for the hovering pop portion of the charts:
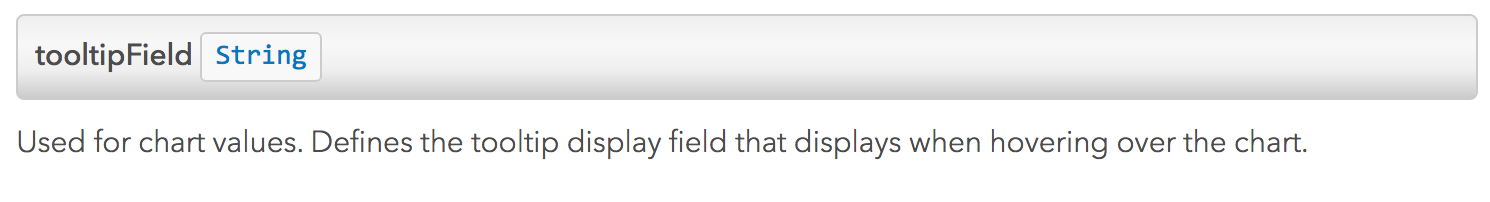
so how come it knows to display the over value as well??