- Home
- :
- All Communities
- :
- Developers
- :
- JavaScript Maps SDK
- :
- JavaScript Maps SDK Questions
- :
- Graph in popupTemplate
- Subscribe to RSS Feed
- Mark Topic as New
- Mark Topic as Read
- Float this Topic for Current User
- Bookmark
- Subscribe
- Mute
- Printer Friendly Page
Graph in popupTemplate
- Mark as New
- Bookmark
- Subscribe
- Mute
- Subscribe to RSS Feed
- Permalink
Hey There Esri Community!
I'm having a little issue here with the graphs inside the popupTemplate.
I was looking at the following example:
ArcGIS API for JavaScript Sandbox
which does a great job in describing the process of creating a pie-chart inside the popupTemplate,
However there is couple things that I don't get from this example that's crucial in order to make it work properly .
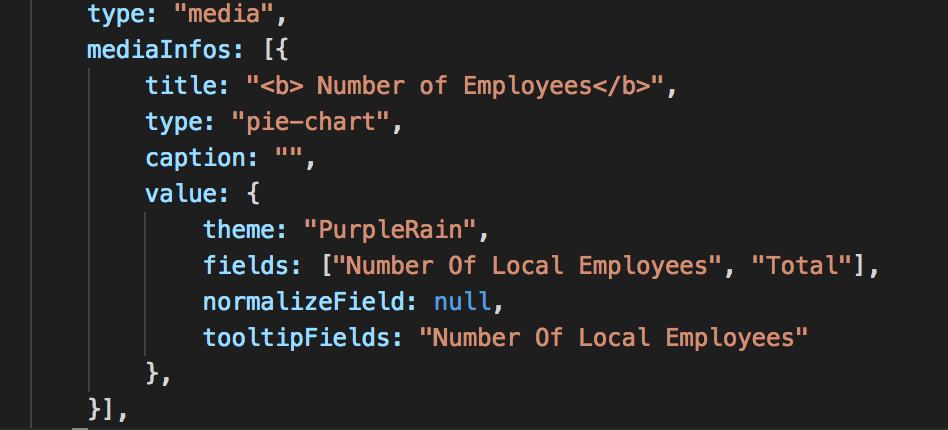
type: "media",
mediaInfos: [{
title: "<b>Count by type</b>",
type: "pie-chart",
caption: "",
value: {
theme: "Grasshopper",
fields: ["relationships/0/Point_Count_COMMON"],
normalizeField: null,
tooltipField: "relationships/0/COMMON"
}
}, specifically this line:
fields: ["relationships/0/Point_Count_COMMON"],I understand that we need to pass the fields which according to them the pie-chart is getting charted, however when I pass my field "Number Of Local Employees" I get one full pie chart with one color, but that's granted I passed only one color, However in the posted code above, the example passes only one field as well and get multiple slices in the same pie chart.
This is somewhat crucial because when I look at the documentation for the tooltipField
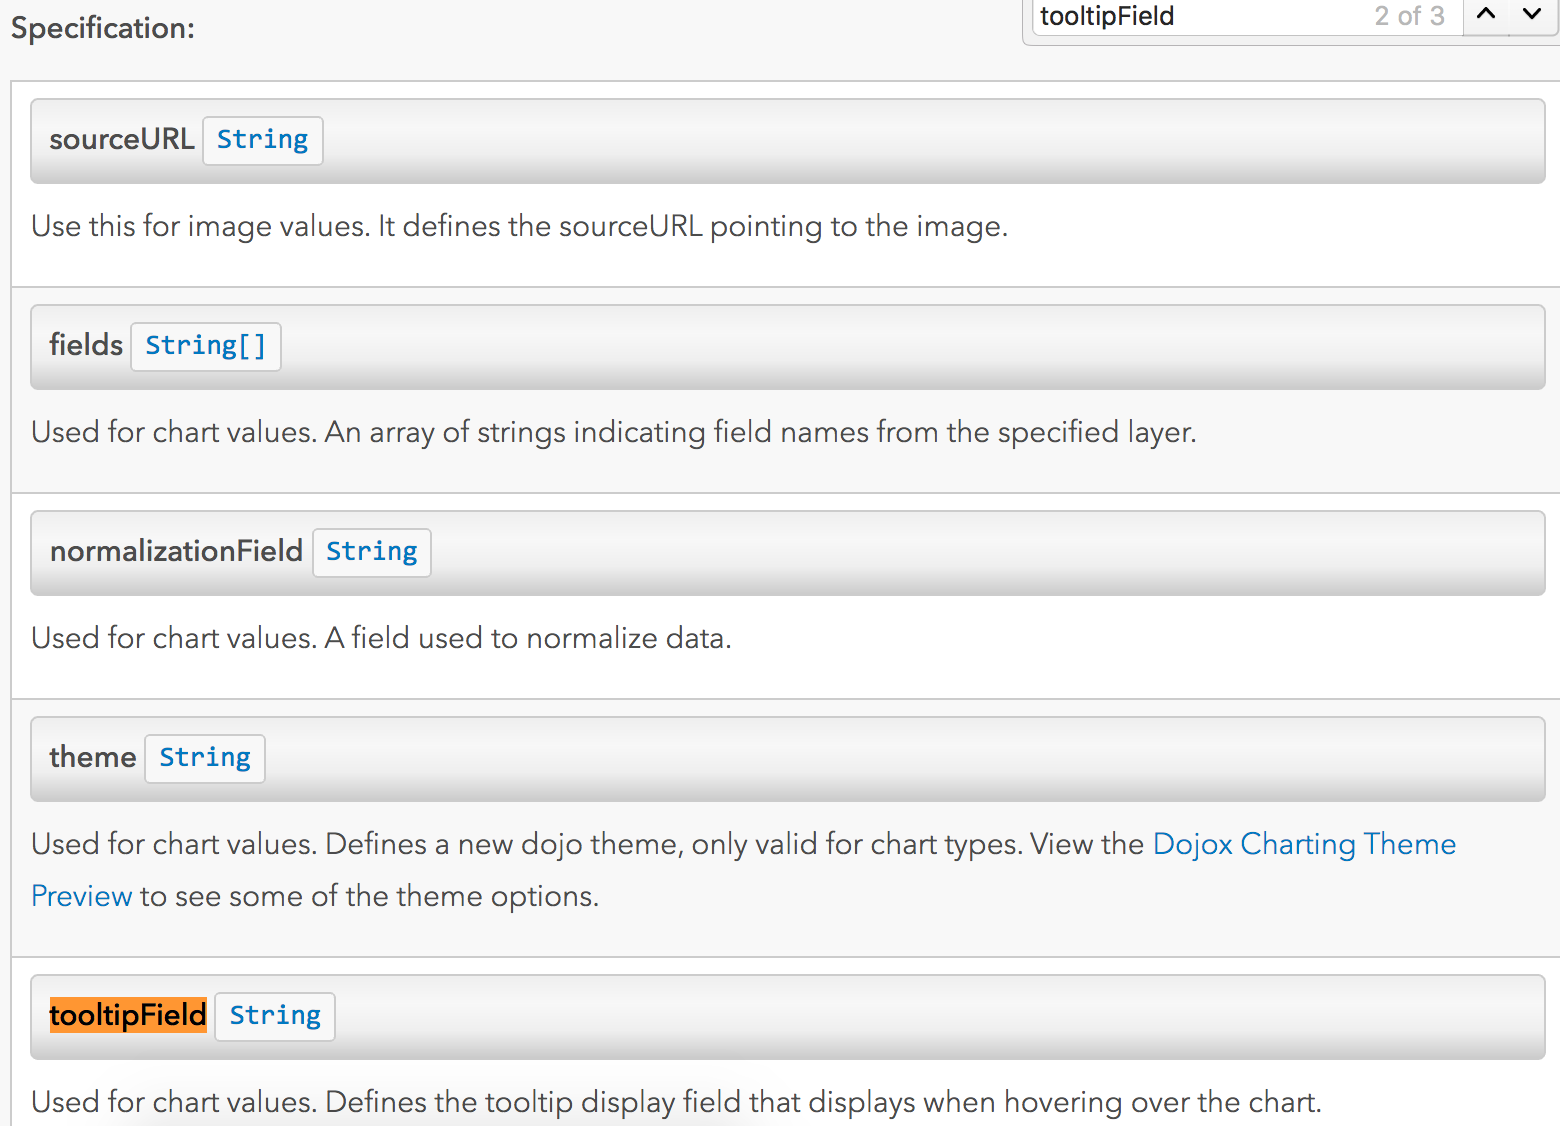
it says that it accepts only a string compared to the fields which accepts an array of strings, so in case I'm passing multiple fields I can only show one type of tooltip in relation to the entered field.
**Regardless of that, I struggle to show any tooltip on hover.
as follows:
I appreciate it if you guys can have a look at it and point out if I'm missing missing,
Thank you,
Anton.
- Mark as New
- Bookmark
- Subscribe
- Mute
- Subscribe to RSS Feed
- Permalink
Is "Number of Local Employees" the name of field? Make sure you specify the field name, not the alias. Also, please note that the above sample has many slices (even though only one field is specified) because it uses all the returned records for the specific feature accessed via the relationship which is available to the service. If not using a relationship, then each value in the specified fields for that feature becomes a slice.
- Mark as New
- Bookmark
- Subscribe
- Mute
- Subscribe to RSS Feed
- Permalink
Thank you John,
I managed to show my pie-chart, however the hover still missing, even though I'm passing only one field (I'm using the field name as you mentioned above) maybe it because the name of the field and the alias are the same?
Also, could you expand on this relationship concept? It seem's like showing multiple slices in a pie-chart is the way to go for me. How would I go about replicating the same result in my case ,when I'm working with JSON objects?
fields property accepts multiple fields, however the tooltipFields only accepts one.
Anton.
- Mark as New
- Bookmark
- Subscribe
- Mute
- Subscribe to RSS Feed
- Permalink
So I had some major developments towards finding a solution.
I managed to precent a pie-chart and doing so in a dynamic manner regardless of what kind of data I'm working with.
The issue I'm experiencing though in regards to the tooltip when hovering on each one of those slices:
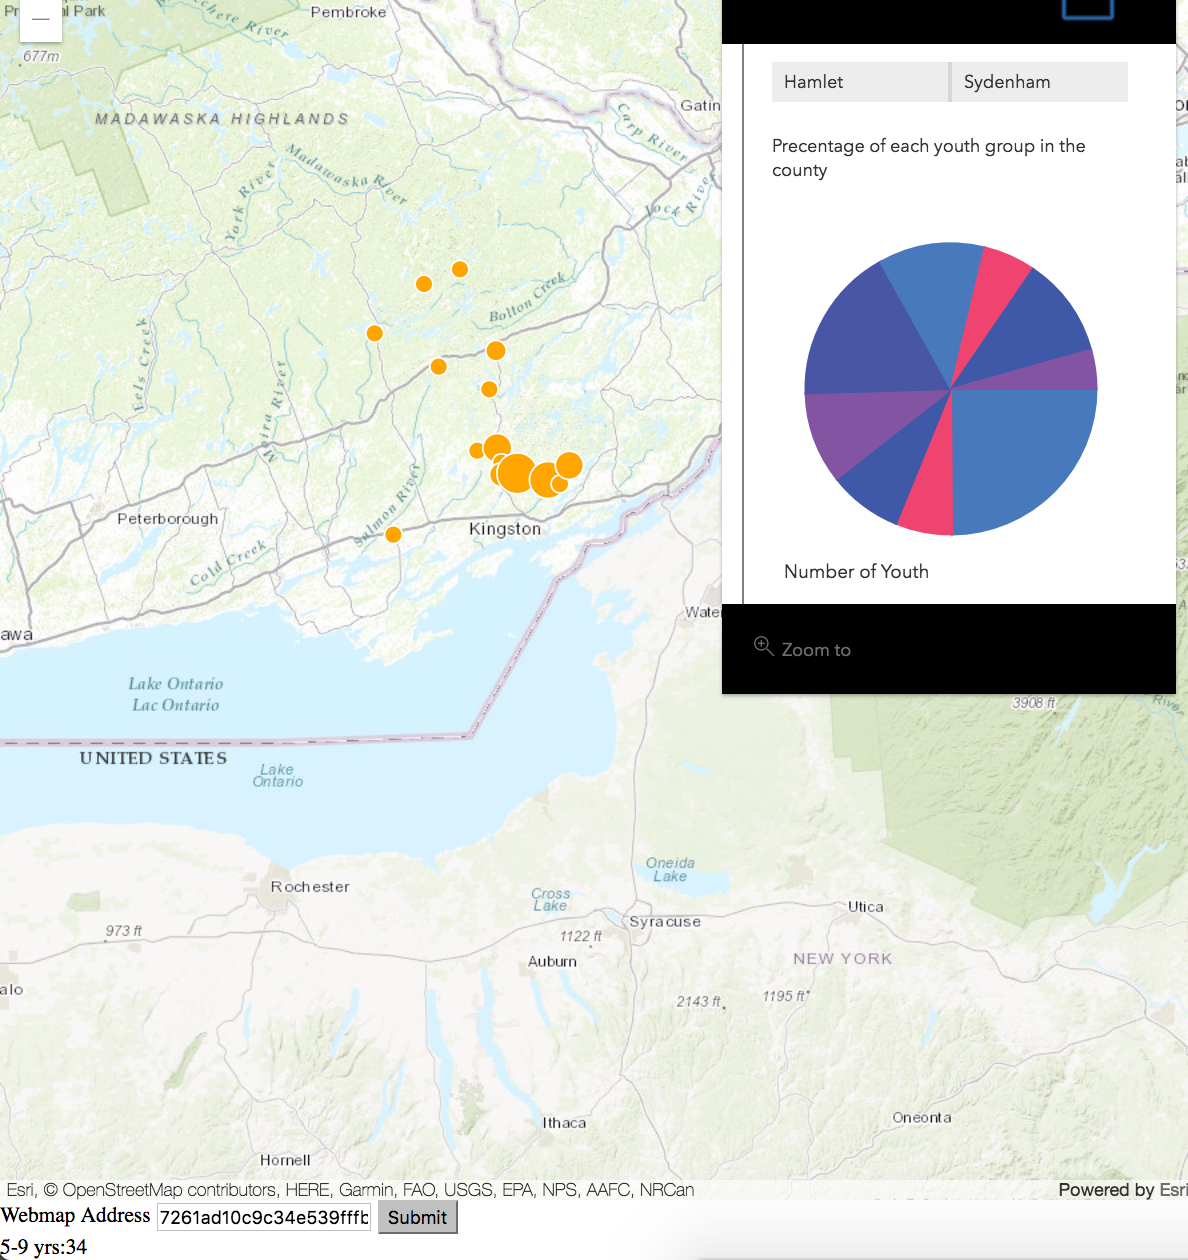
as you can see in the image for some reason whenever I'm hovering on the slices of the pie-chart the data of each of those slices gets presented to at the bottom left corner of this image (5-9 yrs:34) . Instead I would like to have it similar to the way they have it in this example:
ArcGIS API for JavaScript Sandbox
Now understand that they working in their sandbox with hosted layer from their online tool (?), however in my case I'm working with locally fetched data from a JSON file.
This is how my popup tempalate looks like:

Now I removed the tooltipFields property because it wasn't working at all.
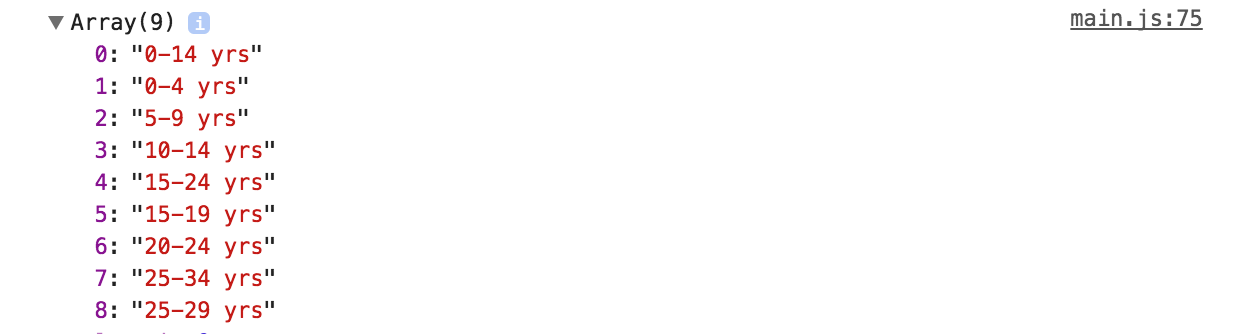
and the fields_to_present array hold the following items:
Please help.