- Home
- :
- All Communities
- :
- Developers
- :
- JavaScript Maps SDK
- :
- JavaScript Maps SDK Questions
- :
- Duplicate Legend entries from 3rd party service
- Subscribe to RSS Feed
- Mark Topic as New
- Mark Topic as Read
- Float this Topic for Current User
- Bookmark
- Subscribe
- Mute
- Printer Friendly Page
Duplicate Legend entries from 3rd party service
- Mark as New
- Bookmark
- Subscribe
- Mute
- Subscribe to RSS Feed
- Permalink
I'm having a problem with duplicate entries showing up in a legend from a FEMA service. Both Layer: Flood Hazard Zones (ID: 28) and Layer: General Structures (ID: 24) both have a UniqueValueRenderer which specifies multiple values that have the same Label and Symbol. When these are displayed in a legend from a LayerList all of these labels and symbols show up in the legend.
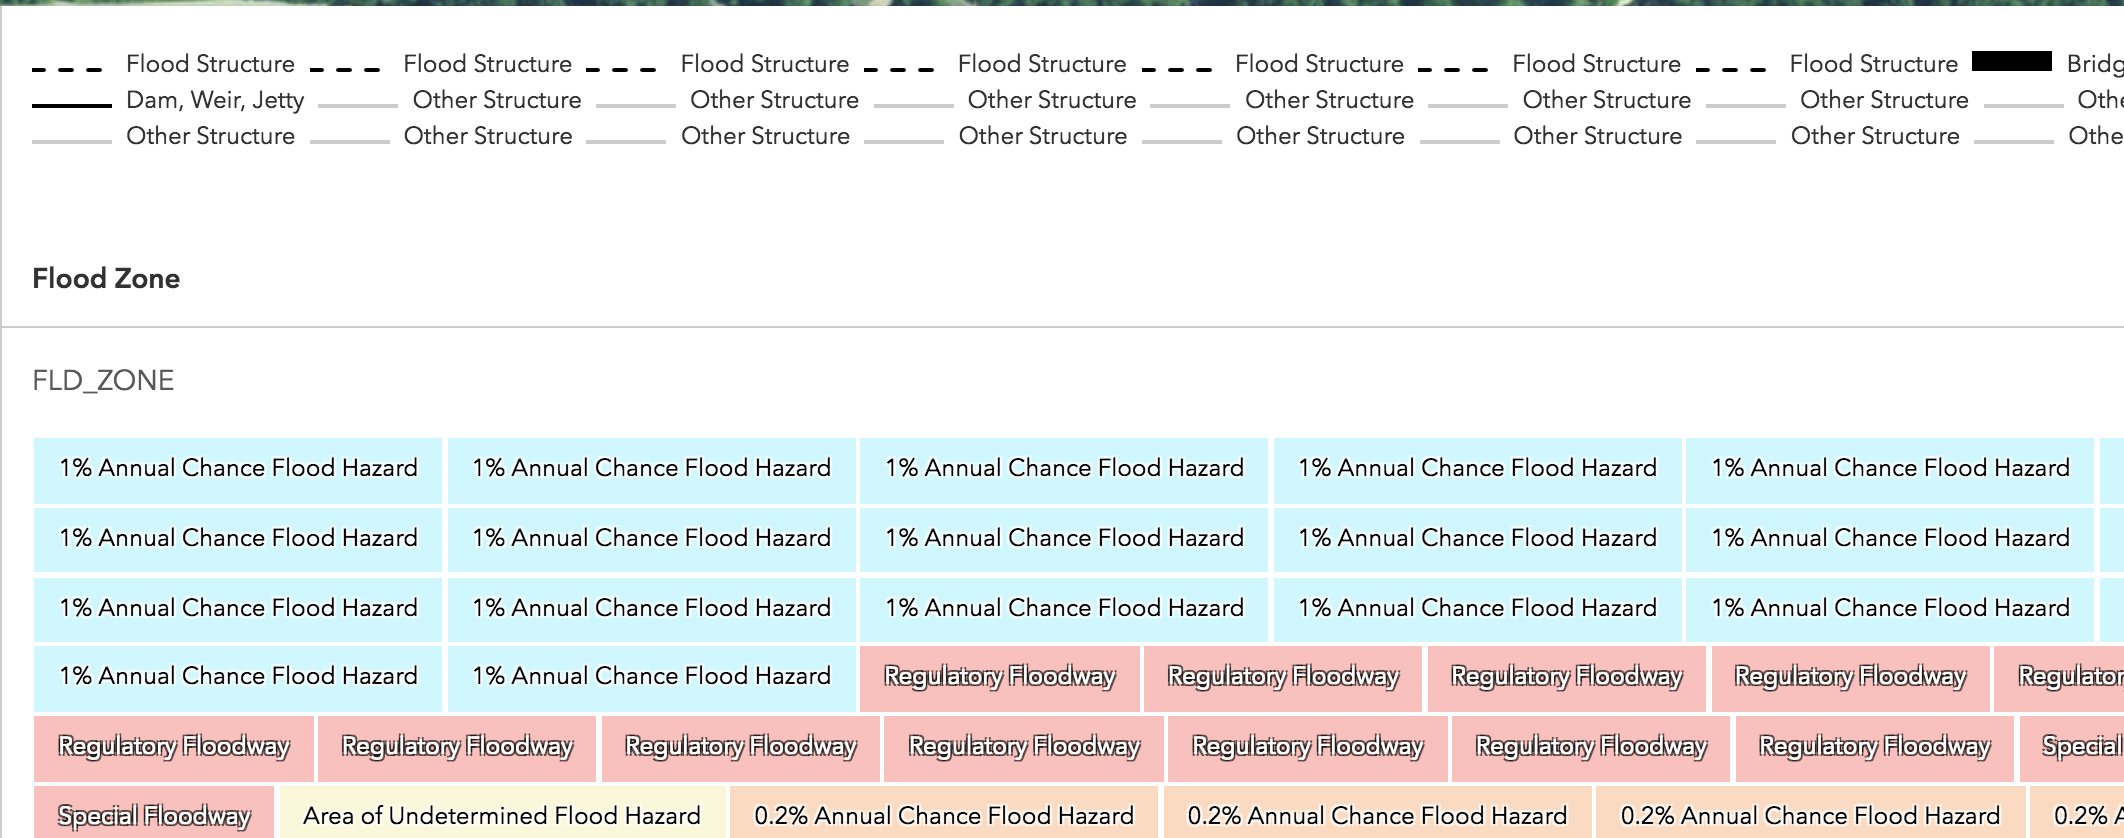
Is there a better way to use these services that won't show duplicate layerInfos in the Legend or should I find another way with jQuery or something to remove the duplicates from the HTML? Below is HTML that works in the latest JS API Sandbox that replicates how I'm using them.
I'd rather not have to build the legend object myself because that would be a rather large time sink for all of the other layers that are in use besides these 2 and could also break if these are updated (which is out of my control). I also didn't see a way to group these by re-creating the renderer manually. I'm still learning the API so if there is a better way to include these than putting them in a FeatureLayer I'd be happy to change that too.
<!DOCTYPE html>
<html>
<head>
<meta charset="utf-8">
<meta name="viewport" content="initial-scale=1,maximum-scale=1,user-scalable=no">
<title>Intro to FeatureLayer - 4.9</title>
<link rel="stylesheet" href="https://js.arcgis.com/4.9/esri/css/main.css">
<script src="https://js.arcgis.com/4.9/"></script>
<style>
html,
body,
#viewDiv {
padding: 0;
margin: 0;
height: 100%;
width: 100%;
}
</style>
<script>
require([
"esri/Map",
"esri/views/MapView",
"esri/layers/FeatureLayer",
"esri/layers/GroupLayer",
"esri/widgets/LayerList",
"esri/widgets/Legend"
],
function(
Map, MapView,
FeatureLayer,
GroupLayer,
LayerList,
Legend
) {
var map = new Map({
basemap: "hybrid"
});
var view = new MapView({
container: "viewDiv",
map: map,
extent: { // autocasts as new Extent()
xmin: -9177811,
ymin: 4247000,
xmax: -9176791,
ymax: 4247784,
spatialReference: 102100
}
});
/********************
* Add feature layer
********************/
var floodZoneLayer = new FeatureLayer({
url: "https://hazards.fema.gov/gis/nfhl/rest/services/public/NFHL/MapServer/28",
title: "Flood Zone",
visible: true
});
var floodStructuresLayer = new FeatureLayer({
url: "https://hazards.fema.gov/gis/nfhl/rest/services/public/NFHL/MapServer/24",
title: "General Structures",
visible: true
});
var group = new GroupLayer({title: "Flood Group", layers: [floodStructuresLayer, floodZoneLayer]});
map.add(group);
var layerList = new LayerList({ view: view , style : { type: "card", layout: "auto" }});
var legend = new Legend({ view: view, style : { type: "card", layout: "stack" }});
view.ui.add(layerList, {position: "bottom-right"});
view.ui.add(legend, {position: "bottom-left"});
});
</script>
</head>
<body>
<div id="viewDiv"></div>
</body>
</html>Solved! Go to Solution.
Accepted Solutions
- Mark as New
- Bookmark
- Subscribe
- Mute
- Subscribe to RSS Feed
- Permalink
Here is how to group the values using Arcade an expression:
<!DOCTYPE html>
<html>
<head>
<meta charset="utf-8">
<meta name="viewport" content="initial-scale=1,maximum-scale=1,user-scalable=no">
<title>Intro to FeatureLayer - 4.9</title>
<link rel="stylesheet" href="https://js.arcgis.com/4.9/esri/css/main.css">
<script src="https://js.arcgis.com/4.9/"></script>
<style>
html,
body,
#viewDiv {
padding: 0;
margin: 0;
height: 100%;
width: 100%;
}
</style>
<script type="text/plain" id="flood-zone">
var fz = $feature.FLD_ZONE;
var zs = $feature.ZONE_SUBTY;
var conc = fz + ";" + zs;
return Decode(conc,'A99;','1per','AE;1 PCT ANNUAL CHANCE FLOOD HAZARD CONTAINED IN CHANNEL', '1per','AE;','1per',
'AH;', '1per','AO;','1per','A;','1per','VE;','1per','V;','1per','AE;COASTAL FLOODPLAIN','1per',
'AE;RIVERINE FLOODPLAIN IN COASTAL AREA','1per','A;COASTAL FLOODPLAIN','1per','A;COMBINED RIVERINE AND COASTAL FLOODPLAIN','1per',
'A;RIVERINE FLOODPLAIN IN COASTAL AREA','1per','VE;COASTAL FLOODPLAIN','1per','VE;COMBINED RIVERINE AND COASTAL FLOODPLAIN','1per',
'VE;RIVERINE FLOODPLAIN IN COASTAL AREA','1per','V;COASTAL FLOODPLAIN','1per','V;COMBINED RIVERINE AND COASTAL FLOODPLAIN','1per',
'V;RIVERINE FLOODPLAIN IN COASTAL AREA','1per','A99;AREA WITH REDUCED FLOOD RISK DUE TO LEVEE','1per','AE;1 PCT CONTAINED IN STRUCTURE, COMMUNITY ENCROACHMENT','rf','AE;1 PCT CONTAINED IN STRUCTURE, FLOODWAY','rf',
'AE;ADMINISTRATIVE FLOODWAY','rf','AE;COMMUNITY ENCROACHMENT AREA','rf','AE;FLOODWAY','rf','AE;FLOODWAY CONTAINED IN CHANNEL','rf',
'AE;RIVERINE FLOODWAY IN COMBINED RIVERINE AND COASTAL ZONE','rf','AO;FLOODWAY','rf','A;ADMINISTRATIVE FLOODWAY','rf',
'A;FLOODWAY','rf','VE;RIVERINE FLOODWAY IN COMBINED RIVERINE AND COASTAL ZONE','rf','VE;RIVERINE FLOODWAY SHOWN IN COASTAL ZONE','rf',
'V;RIVERINE FLOODWAY IN COMBINED RIVERINE AND COASTAL ZONE','rf','AE;AREA OF SPECIAL CONSIDERATION','sf','AE;COLORADO RIVER','sf',
'AE;DENSITY FRINGE AREA','sf','AE;COLORADO RIVER FLOODWAY','sf','d;','ufh','X;0.2 PCT ANNUAL CHANCE FLOOD HAZARD IN COASTAL ZONE','p2per',
'X;0.2 PCT ANNUAL CHANCE FLOOD HAZARD IN COMBINED RIVERINE AND COASTAL ZONE','p2per','X;0.2 PCT ANNUAL CHANCE FLOOD HAZARD','p2per',
'X;0.2 PCT ANNUAL CHANCE FLOOD HAZARD CONTAINED IN CHANNEL','p2per','X;1 PCT DEPTH LESS THAN 1 FOOT','p2per',
'X;1 PCT FUTURE CONDITIONS','future','X;1 PCT FUTURE CONDITIONS, FLOODWAY','future','X;1 PCT FUTURE CONDITONS, COMMUNITY ENCROACHMENT','future',
'X;AREA WITH REDUCED FLOOD RISK DUE TO LEVEE','levee','na');
</script>
<script>
require([
"esri/Map",
"esri/views/MapView",
"esri/layers/FeatureLayer",
"esri/layers/GroupLayer",
"esri/widgets/LayerList",
"esri/widgets/Legend"
],
function(
Map, MapView,
FeatureLayer,
GroupLayer,
LayerList,
Legend
) {
var fzArcade = document.getElementById("flood-zone").text;
var map = new Map({
basemap: "hybrid"
});
var view = new MapView({
container: "viewDiv",
map: map,
extent: { // autocasts as new Extent()
xmin: -9177811,
ymin: 4247000,
xmax: -9176791,
ymax: 4247784,
spatialReference: 102100
}
});
/********************
* Add feature layer
********************/
var fzlRenderer = {
type: "unique-value",
valueExpression: fzArcade,
uniqueValueInfos: [{
value: "1per",
symbol: {
type: "simple-fill", // autocasts as new SimpleFillSymbol()
color: "#00c3ff",
outline: {
width: 0.5,
color: [ 0, 0, 0, 0.2 ]
}
},
label: "1% Annual Chance Flood Hazard"
}, {
value: "rf",
symbol: {
type: "simple-fill",
color: [255, 0, 0, 255],
style: "backward-diagonal",
outline: {
width: 1,
color: [ 0, 0, 0, 0 ]
}
},
label: "Regulatory Floodway"
}, {
value: "sf",
symbol: {
type: "simple-fill",
color: [255, 0, 0, 255],
style: "solid",
outline: {
width: 1,
color: [ 0, 0, 0, 0 ]
}
},
label: "Special Floodway"
}, {
value: "ufh",
symbol: {
type: "simple-fill",
color: [242, 230, 115, 255],
style: "solid",
outline: {
width: 1,
color: [ 0, 0, 0, 0 ]
}
},
label: "Area of Undetermined Flood Hazard"
}, {
value: "p2per",
symbol: {
type: "simple-fill",
color: [255, 128, 0, 255],
style: "solid",
outline: {
width: 1,
color: [ 0, 0, 0, 0 ]
}
},
label: "0.2% Annual Chance Flood Hazard"
}, {
value: "future",
symbol: {
type: "simple-fill",
color: [0, 0, 0, 255],
style: "solid",
outline: {
width: 1,
color: [ 0, 0, 0, 0 ]
}
},
label: "Future Conditions 1% Annual Chance Flood Hazard"
}, {
value: "levee",
symbol: {
type: "simple-fill",
color: [0, 0, 0, 255],
style: "solid",
outline: {
width: 1,
color: [ 0, 0, 0, 0 ]
}
},
label: "Area with Reduced Risk Due to Levee"
}]
};
var floodZoneLayer = new FeatureLayer({
url: "https://hazards.fema.gov/gis/nfhl/rest/services/public/NFHL/MapServer/28",
title: "Flood Zone",
visible: true,
renderer: fzlRenderer
});
var floodStructuresLayer = new FeatureLayer({
url: "https://hazards.fema.gov/gis/nfhl/rest/services/public/NFHL/MapServer/24",
title: "General Structures",
visible: true
});
var group = new GroupLayer({title: "Flood Group", layers: [floodStructuresLayer, floodZoneLayer]});
map.add(group);
var layerList = new LayerList({ view: view , style : { type: "card", layout: "auto" }});
var legend = new Legend({ view: view, style : { type: "card", layout: "stack" }});
view.ui.add(layerList, {position: "bottom-right"});
view.ui.add(legend, {position: "bottom-left"});
});
</script>
</head>
<body>
<div id="viewDiv"></div>
</body>
</html>
- Mark as New
- Bookmark
- Subscribe
- Mute
- Subscribe to RSS Feed
- Permalink
Thanks Robert Scheitlin, GISP. That worked great!
Spent too much time looking through the documentation and I must have skipped over the valueExpression property.