Turn on suggestions
Auto-suggest helps you quickly narrow down your search results by suggesting possible matches as you type.
Cancel
- Home
- :
- All Communities
- :
- Developers
- :
- JavaScript Maps SDK
- :
- JavaScript Maps SDK Questions
- :
- Create Dialog Box Dynamically,Get user input value...
Options
- Subscribe to RSS Feed
- Mark Topic as New
- Mark Topic as Read
- Float this Topic for Current User
- Bookmark
- Subscribe
- Mute
- Printer Friendly Page
Create Dialog Box Dynamically,Get user input values and Add Text Graphics on Map ?
Subscribe
04-24-2019
01:47 AM
- Mark as New
- Bookmark
- Subscribe
- Mute
- Subscribe to RSS Feed
- Permalink
Hi,
I have requirement to add text graphics on Map. User will click on Draw tool and then click on Map, When user click on Map open the dialog window like below.
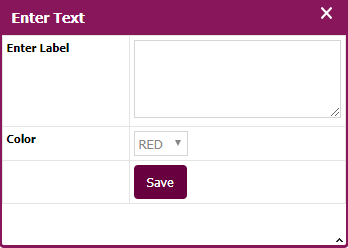
User will enter text and chose color(Red, Black) from drop down and when click on save button get values of textbox and drop down selected value and add text on Map.
I am able to add text Graphics on Map without dialog box, but I am not getting how to create Dialog dynamically like above screenshot, fire event of Save button and when you click on save button add text graphics on Map.
Below is my code to add text graphic without dialog box.
drawText: function () {
var drawTextClickHanlder = this.map.on('click', lang.hitch(this, function (evt, override) {
var textSymbol = new TextSymbol(
"Text",
 this.textFont,
 this.textColor
 );
 var textGraphic = new Graphic(evt.mapPoint, textSymbol);
 this.textGraphics.add(textGraphic);
 this.connectMapClick();
 drawTextClickHanlder.remove();
}));
}
Thanks,
Solved! Go to Solution.
1 Solution
Accepted Solutions
04-25-2019
12:06 PM
- Mark as New
- Bookmark
- Subscribe
- Mute
- Subscribe to RSS Feed
- Permalink
Mayur,
Here is a sample that shows that:
<!DOCTYPE html>
<html>
<head>
<meta charset="utf-8" />
<meta name="viewport" content="initial-scale=1,maximum-scale=1,user-scalable=no" />
<title>Label</title>
<link rel="stylesheet" href="https://js.arcgis.com/4.11/esri/themes/light/main.css" />
<link rel="stylesheet" type="text/css" href="https://js.arcgis.com/4.11/dojox/layout/resources/FloatingPane.css" />
<script src="https://js.arcgis.com/4.11/"></script>
<style>
html,
body,
#viewDiv {
padding: 0;
margin: 0;
height: 100%;
width: 100%;
}
.dojoxFloatingPaneTitle .dijitTitleNode {
padding-left: 5px;
color: white;
}
.dojoxDock {
display: none;
}
.dojoxFloatingPaneTitle,
.dojoxFloatingPane {
border: #88165b;
background: #88165b;
height: 25px;
}
#entryDiv {
padding: 8px;
float: left;
}
.formLbl {
float: left;
}
.formLine {
width: 100%;
padding-bottom: 8px;
}
</style>
<script>
let efp;
require([
"esri/views/draw/Draw",
"esri/Map",
"esri/Graphic",
"esri/layers/GraphicsLayer",
"esri/geometry/Point",
"esri/views/MapView",
"esri/symbols/TextSymbol",
"dojo/dom",
"dojox/layout/FloatingPane",
"dojo/domReady!"
], function (Draw, Map, Graphic, GraphicsLayer, Point, MapView, TextSymbol, dom, FloatingPane) {
const textGraphics = new GraphicsLayer();
let drawPnt;
const map = new Map({
basemap: "streets",
layers: [textGraphics]
});
const view = new MapView({
container: "viewDiv",
map: map,
zoom: 12,
center: [18.06, 59.34]
});
const draw = new Draw({
view: view
});
efp = new FloatingPane({
title: "Enter Text",
closable: false,
resizable: true,
dockable: true,
style: "position:absolute;top:250px;left:350px;width:260px;height:300px;visibility:hidden;max-height:400px;",
id: "efp"
}, dom.byId("divFloatingPane"));
efp.startup();
view.ui.add("point-button", "top-left");
document.getElementById("btnSave").onclick = function() {
var textSymbol = new TextSymbol({
text: dom.byId("LabelText").value,
color: dom.byId("colorSelect").value,
font: { // autocast as new Font()
size: 12,
family: "sans-serif",
weight: "bold"
}
});
var textGraphic = new Graphic(drawPnt, textSymbol);
textGraphics.add(textGraphic);
efp.hide();
}
document.getElementById("point-button").onclick = function () {
const action = draw.create("point", {
mode: "click"
});
view.focus();
action.on("draw-complete", function (evt) {
drawPnt = new Point({
x: evt.coordinates[0],
y: evt.coordinates[1],
spatialReference: view.spatialReference
})
efp.show();
});
};
});
</script>
</head>
<body>
<div id="viewDiv">
<div id="point-button" class="esri-widget esri-widget--button esri-interactive" title="Draw label">
<span class="esri-icon-map-pin"></span>
</div>
<div id="divFloatingPane">
<div id="entryDiv">
<div class="formLine">
<div class="formLbl" for="LabelText" style="width:84px;">Enter Label</div>
<textarea id="LabelText" style="width:152px;"></textarea>
</div>
<div class="formLine">
<div class="formLbl" style="width:84px;">Color</div>
<select id="colorSelect">
<option value="red" selected="selected">RED</option>
<option value="black">BLACK</option>
</select>
</div>
<div class="formLine">
<div class="formLbl" style="width:84px;"> </div>
<button id="btnSave">Save</button>
</div>
</div>
</div>
</div>
</body>
</html>
1 Reply
04-25-2019
12:06 PM
- Mark as New
- Bookmark
- Subscribe
- Mute
- Subscribe to RSS Feed
- Permalink
Mayur,
Here is a sample that shows that:
<!DOCTYPE html>
<html>
<head>
<meta charset="utf-8" />
<meta name="viewport" content="initial-scale=1,maximum-scale=1,user-scalable=no" />
<title>Label</title>
<link rel="stylesheet" href="https://js.arcgis.com/4.11/esri/themes/light/main.css" />
<link rel="stylesheet" type="text/css" href="https://js.arcgis.com/4.11/dojox/layout/resources/FloatingPane.css" />
<script src="https://js.arcgis.com/4.11/"></script>
<style>
html,
body,
#viewDiv {
padding: 0;
margin: 0;
height: 100%;
width: 100%;
}
.dojoxFloatingPaneTitle .dijitTitleNode {
padding-left: 5px;
color: white;
}
.dojoxDock {
display: none;
}
.dojoxFloatingPaneTitle,
.dojoxFloatingPane {
border: #88165b;
background: #88165b;
height: 25px;
}
#entryDiv {
padding: 8px;
float: left;
}
.formLbl {
float: left;
}
.formLine {
width: 100%;
padding-bottom: 8px;
}
</style>
<script>
let efp;
require([
"esri/views/draw/Draw",
"esri/Map",
"esri/Graphic",
"esri/layers/GraphicsLayer",
"esri/geometry/Point",
"esri/views/MapView",
"esri/symbols/TextSymbol",
"dojo/dom",
"dojox/layout/FloatingPane",
"dojo/domReady!"
], function (Draw, Map, Graphic, GraphicsLayer, Point, MapView, TextSymbol, dom, FloatingPane) {
const textGraphics = new GraphicsLayer();
let drawPnt;
const map = new Map({
basemap: "streets",
layers: [textGraphics]
});
const view = new MapView({
container: "viewDiv",
map: map,
zoom: 12,
center: [18.06, 59.34]
});
const draw = new Draw({
view: view
});
efp = new FloatingPane({
title: "Enter Text",
closable: false,
resizable: true,
dockable: true,
style: "position:absolute;top:250px;left:350px;width:260px;height:300px;visibility:hidden;max-height:400px;",
id: "efp"
}, dom.byId("divFloatingPane"));
efp.startup();
view.ui.add("point-button", "top-left");
document.getElementById("btnSave").onclick = function() {
var textSymbol = new TextSymbol({
text: dom.byId("LabelText").value,
color: dom.byId("colorSelect").value,
font: { // autocast as new Font()
size: 12,
family: "sans-serif",
weight: "bold"
}
});
var textGraphic = new Graphic(drawPnt, textSymbol);
textGraphics.add(textGraphic);
efp.hide();
}
document.getElementById("point-button").onclick = function () {
const action = draw.create("point", {
mode: "click"
});
view.focus();
action.on("draw-complete", function (evt) {
drawPnt = new Point({
x: evt.coordinates[0],
y: evt.coordinates[1],
spatialReference: view.spatialReference
})
efp.show();
});
};
});
</script>
</head>
<body>
<div id="viewDiv">
<div id="point-button" class="esri-widget esri-widget--button esri-interactive" title="Draw label">
<span class="esri-icon-map-pin"></span>
</div>
<div id="divFloatingPane">
<div id="entryDiv">
<div class="formLine">
<div class="formLbl" for="LabelText" style="width:84px;">Enter Label</div>
<textarea id="LabelText" style="width:152px;"></textarea>
</div>
<div class="formLine">
<div class="formLbl" style="width:84px;">Color</div>
<select id="colorSelect">
<option value="red" selected="selected">RED</option>
<option value="black">BLACK</option>
</select>
</div>
<div class="formLine">
<div class="formLbl" style="width:84px;"> </div>
<button id="btnSave">Save</button>
</div>
</div>
</div>
</div>
</body>
</html>