- Home
- :
- All Communities
- :
- Developers
- :
- JavaScript Maps SDK
- :
- JavaScript Maps SDK Questions
- :
- Re: Coded Domain values when doing Query tasks
- Subscribe to RSS Feed
- Mark Topic as New
- Mark Topic as Read
- Float this Topic for Current User
- Bookmark
- Subscribe
- Mute
- Printer Friendly Page
- Mark as New
- Bookmark
- Subscribe
- Mute
- Subscribe to RSS Feed
- Permalink
Hello Friends, i saw lots of discussions on coded Domain values when doing Query tasks. But not a single is useful for me yet. I am having same question as you explain here. Can you please help me with the same for 4.9 API.
I am having 2 attributes with coded values..I want to add a drop down menu to selecting values for that specific attribute. So user can select specific value of that attribute and perform query task.
Right now am using below function..
Thank you.
let Status = new Query({
returnGeometry: false,
where: '1=1',
returnDistinctValues: true,
outFields: ['STATUS']
});
qTask1.execute(Status).then(function(results) {
results.features.map(function(feat) {
let opt5 = document.createElement('option');
opt5.value = feat.attributes.STATUS;
opt5.innerHTML = feat.attributes.STATUS;
stadd.appendChild(opt5);
});
view.graphic.add(selectedGraphics);
});
let qSubtype = new Query({
returnGeometry: false,
where: '1=1',
returnDistinctValues: true,
outFields: ['SUBTYPE']
});
qTask72.execute(qSubtype).then(function(results) {
results.features.map(function(feat) {
let opt3 = document.createElement('option');
opt3.value = feat.attributes.SUBTYPE;
opt3.innerHTML = feat.attributes.SUBTYPE;
subdd.appendChild(opt3);
});
view.graphic.add(selectedGraphics);
});
Solved! Go to Solution.
Accepted Solutions
- Mark as New
- Bookmark
- Subscribe
- Mute
- Subscribe to RSS Feed
- Permalink
RAJ,
It's a bit of work to put together a sample each time.
<!DOCTYPE html>
<html>
<head>
<meta charset="utf-8">
<meta name="viewport" content="initial-scale=1,maximum-scale=1,user-scalable=no">
<title>QueryTask - 4.9</title>
<style>
html,
body,
#viewDiv {
padding: 0;
margin: 0;
height: 100%;
width: 100%;
overflow: hidden;
}
#viewDiv.withGrid {
height: 65%;
}
.esri-widget {
padding-left: 8px;
padding-right: 4px;
}
#paneDiv {
position: absolute;
top: 10px;
left: 62px;
padding: 0 12px 0 12px;
background-color: rgba(0, 0, 0, 0.5);
color: white;
}
.info {
line-height: 20px;
padding-left: 5px ! important;
}
.action-button {
font-size: 16px;
background-color: transparent;
border: 1px solid #D3D3D3;
color: #6e6e6e;
height: 32px;
width: 32px;
text-align: center;
box-shadow: 0 0 1px rgba(0, 0, 0, 0.3);
}
.action-button:hover,
.action-button:focus {
background: #0079c1;
color: #e4e4e4;
}
.active {
background: #0079c1;
color: #e4e4e4;
}
</style>
<link rel="stylesheet" href="https://js.arcgis.com/4.9/esri/css/main.css">
<script src="https://js.arcgis.com/4.9/"></script>
<script>
let vlayerView;
require([
"esri/Map",
"esri/views/MapView",
"esri/widgets/Home",
"esri/widgets/Legend",
"esri/widgets/Search",
"esri/layers/GraphicsLayer",
"esri/layers/FeatureLayer",
"esri/Graphic",
"esri/widgets/Sketch/SketchViewModel",
"esri/tasks/QueryTask",
"esri/tasks/support/Query",
"dojo/_base/array",
"dojo/dom",
"dojo/on",
"dojo/dom-class",
"dojo/domReady!"
],
function(
Map, MapView, Home, Legend, Search, GraphicsLayer, FeatureLayer, Graphic, SketchViewModel, QueryTask, Query, arrayUtils, dom, on,
domClass
) {
let map, view, grid, editGraphic;
const tempGraphicsLayer = new GraphicsLayer();
let pUrl = "https://services.arcgis.com/V6ZHFr6zdgNZuVG0/ArcGIS/rest/services/2012_CA_NHTSA/FeatureServer/0";
let pFL = new FeatureLayer({
url: pUrl,
outFields:['*']
});
let qUVp= new Query({
returnGeometry: false,
where: '1=1',
returnDistinctValues: true,
outFields: ['sex'],
orderByFields: ['sex ASC']
});
pFL.queryFeatures(qUVp).then(function(results){
arrayUtils.map(results.features, function(feat){
let opt2 = document.createElement('option');
opt2.value = feat.attributes.sex;
opt2.innerHTML = pFL.getFeatureType(feat).name;
sexdd.appendChild(opt2);
});
});
// Define the popup content for each result
const popupTemplate = { // autocasts as new PopupTemplate()
title: "Accident Info",
fieldInfos: [{
fieldName: "atmcond",
label: "Atmospheric Condition"
}, {
fieldName: "numfatal",
label: "Fatalities in Crash",
format: {
places: 0,
digitSeperator: true
}
}, {
fieldName: "conszone",
label: "Work Zone"
}, {
fieldName: "age",
label: "Age",
format: {
places: 0,
digitSeperator: true
}
}, {
fieldName: "alcres",
label: "Alcohol Test Results"
}, {
fieldName: "sex",
label: "Sex"
}],
content: "<b>Atmospheric Condition:</b> {atmcond}" +
"<br><b>Prominence Rank:</b> {RANK}" +
"<br><b>Fatalities in Crash:</b> {numfatal}" +
"<br><b>Work Zone:</b> {conszone}" +
"<br></b>Age:</b> {age}" +
"<br></b>Alcohol Test Results:</b> {alcres}" +
"<br></bSex:</b> {sex}"
};
let resultsLayer = new GraphicsLayer();
let qTask = new QueryTask({
url: pUrl
});
let params = new Query({
returnGeometry: true
});
map = new Map({
basemap: "streets",
layers: [resultsLayer, tempGraphicsLayer]
});
view = new MapView({
map: map,
container: "viewDiv",
zoom: 3,
popup: {
dockEnabled: true,
dockOptions: {
position: "top-right",
breakpoint: false
}
}
});
view.when(function() {
view.ui.add("optionsDiv", "bottom-right");
on(dom.byId("doBtn"), "click", doQuery);
on(dom.byId("clrBtn"), "click", doClear);
//Query to get unique vals
let opt = document.createElement('option');
opt.value = "";
opt.innerHTML = "select Sex";
sexdd.appendChild(opt);
});
const sexdd = dom.byId("sexSelect");
function doClear() {
resultsLayer.removeAll();
}
function doQuery() {
doClear();
// Clear the results from a previous query
resultsLayer.removeAll();
params.where = "sex = '" + sexdd.value + "'";
if (tempGraphicsLayer.graphics.length > 0) {
params.geometry = tempGraphicsLayer.graphics.getItemAt(0).geometry;
}
params.outFields = ["*"];
qTask.execute(params)
.then(getResults)
.catch(promiseRejected);
}
function getResults(response) {
let graphics = response.features;
var RResults = arrayUtils.map(response.features, function(
feature) {
feature.symbol = {
type: "simple-marker",
color: "red",
size: 5,
outline: {
color: "black"
}
};
feature.popupTemplate = popupTemplate;
return feature;
});
resultsLayer.addMany(RResults);
view.goTo(RResults);
}
function promiseRejected(error) {
console.error("Promise rejected: ", error.message);
}
var homeBtn = new Home({
view: view
}, "homeDiv");
var legend = new Legend({
view: view,
layerInfos: [{
url: pUrl
}]
});
legend.startup();
view.ui.add(legend, "bottom-left");
var searchWidget = new Search({
view: view
});
view.ui.add(searchWidget, {
position: "top-right"
});
view.when(function() {
// create a new sketch view model
const sketchViewModel = new SketchViewModel({
view: view,
layer: tempGraphicsLayer,
pointSymbol: {
type: "simple-marker", // autocasts as new SimpleMarkerSymbol()
style: "square",
color: "#8A2BE2",
size: "16px",
outline: { // autocasts as new SimpleLineSymbol()
color: [255, 255, 255],
width: 3
}
},
polylineSymbol: {
type: "simple-line", // autocasts as new SimpleLineSymbol()
color: "#8A2BE2",
width: "4",
style: "dash"
},
polygonSymbol: {
type: "simple-fill", // autocasts as new SimpleFillSymbol()
color: "rgba(138,43,226, 0.8)",
style: "solid",
outline: {
color: "white",
width: 1
}
}
});
setUpClickHandler();
// Listen to create-complete event to add a newly created graphic to view
sketchViewModel.on("create-complete", addGraphic);
// Listen the sketchViewModel's update-complete and update-cancel events
sketchViewModel.on("update-complete", updateGraphic);
sketchViewModel.on("update-cancel", updateGraphic);
//*************************************************************
// called when sketchViewModel's create-complete event is fired.
//*************************************************************
function addGraphic(event) {
// Create a new graphic and set its geometry to
// `create-complete` event geometry.
const graphic = new Graphic({
geometry: event.geometry,
symbol: sketchViewModel.graphic.symbol
});
tempGraphicsLayer.add(graphic);
}
//***************************************************************
// called when sketchViewModel's update-complete or update-cancel
// events are fired.
//*************************************************************
function updateGraphic(event) {
// event.graphic is the graphic that user clicked on and its geometry
// has not been changed. Update its geometry and add it to the layer
event.graphic.geometry = event.geometry;
tempGraphicsLayer.add(event.graphic);
// set the editGraphic to null update is complete or cancelled.
editGraphic = null;
}
// ************************************************************************************
// set up logic to handle geometry update and reflect the update on "tempGraphicsLayer"
// ************************************************************************************
function setUpClickHandler() {
view.on("click", function(event) {
view.hitTest(event).then(function(response) {
var results = response.results;
// Found a valid graphic
if (results.length && results[results.length - 1]
.graphic) {
// Check if we're already editing a graphic
if (!editGraphic) {
// Save a reference to the graphic we intend to update
editGraphic = results[results.length - 1].graphic;
// Remove the graphic from the GraphicsLayer
// Sketch will handle displaying the graphic while being updated
tempGraphicsLayer.remove(editGraphic);
sketchViewModel.update(editGraphic);
}
}
});
});
}
//*************************************
// activate the sketch to create a point
//*************************************
var drawPointButton = document.getElementById("pointButton");
drawPointButton.onclick = function() {
// set the sketch to create a point geometry
sketchViewModel.create("point");
setActiveButton(this);
};
//****************************************
// activate the sketch to create a polyline
//****************************************
var drawLineButton = document.getElementById("polylineButton");
drawLineButton.onclick = function() {
// set the sketch to create a polyline geometry
sketchViewModel.create("polyline");
setActiveButton(this);
};
//***************************************
// activate the sketch to create a polygon
//***************************************
var drawPolygonButton = document.getElementById("polygonButton");
drawPolygonButton.onclick = function() {
// set the sketch to create a polygon geometry
sketchViewModel.create("polygon");
setActiveButton(this);
};
//***************************************
// activate the sketch to create a rectangle
//***************************************
var drawRectangleButton = document.getElementById(
"rectangleButton");
drawRectangleButton.onclick = function() {
// set the sketch to create a polygon geometry
sketchViewModel.create("rectangle");
setActiveButton(this);
};
//***************************************
// activate the sketch to create a circle
//***************************************
var drawCircleButton = document.getElementById("circleButton");
drawCircleButton.onclick = function() {
// set the sketch to create a polygon geometry
sketchViewModel.create("circle");
setActiveButton(this);
};
//**************
// reset button
//**************
document.getElementById("resetBtn").onclick = function() {
sketchViewModel.reset();
tempGraphicsLayer.removeAll();
setActiveButton();
};
function setActiveButton(selectedButton) {
// focus the view to activate keyboard shortcuts for sketching
view.focus();
var elements = document.getElementsByClassName("active");
for (var i = 0; i < elements.length; i++) {
elements[i].classList.remove("active");
}
if (selectedButton) {
selectedButton.classList.add("active");
}
}
});
});
</script>
</head>
<body>
<div id="viewDiv">
<div class="esri-widget" id="optionsDiv">
<h2>Fatal Accidents in California by Sex</h2>
<select class="esri-widget" id="sexSelect"></select>
<br>
<br>
<div id="topbar">
<button class="action-button esri-icon-blank-map-pin" id="pointButton" type="button" title="Draw point"></button>
<button class="action-button esri-icon-polyline" id="polylineButton" type="button" title="Draw polyline"></button>
<button class="action-button esri-icon-polygon" id="polygonButton" type="button" title="Draw polygon"></button>
<button class="action-button esri-icon-checkbox-unchecked" id="rectangleButton" type="button" title="Draw rectangle"></button>
<button class="action-button esri-icon-radio-unchecked" id="circleButton" type="button" title="Draw circle"></button>
<button class="action-button esri-icon-trash" id="resetBtn" type="button" title="Clear graphics"></button>
</div>
<br>
<button class="esri-widget" id="doBtn">Do Query</button>
<button class="esri-widget" id="clrBtn">Clear</button>
<br>
<br>
</div>
</div>
</body>
</html>
- Mark as New
- Bookmark
- Subscribe
- Mute
- Subscribe to RSS Feed
- Permalink
RAJ,
Does your data use actual esri subTypes?
- Mark as New
- Bookmark
- Subscribe
- Mute
- Subscribe to RSS Feed
- Permalink
I didn't get this.. Which Types you asking about...?
- Mark as New
- Bookmark
- Subscribe
- Mute
- Subscribe to RSS Feed
- Permalink
RAJ,
If you do not know then you most likely are not using them. But this is what a esri subType is:
- Mark as New
- Bookmark
- Subscribe
- Mute
- Subscribe to RSS Feed
- Permalink
Yes Robert, i have a data with esri subTypes..
these attributes having code and description for that same like you shown
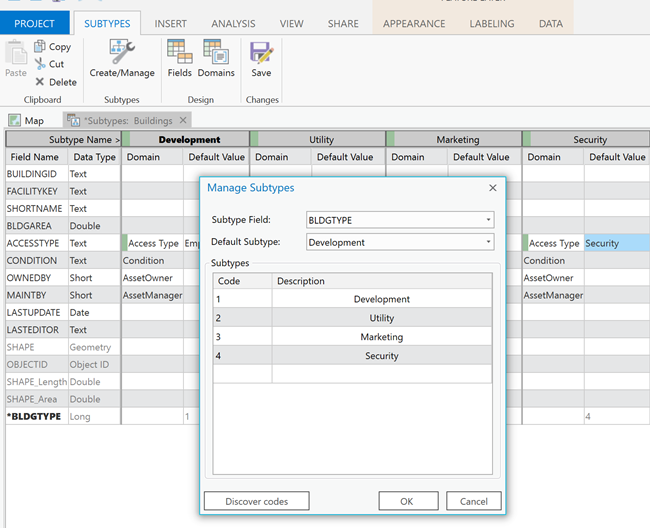
So if we consider a attribute "SUBTYPE", it having codes 1,2,3,4,5,6,7,9,10....and for this codes database having particular Description.
- Mark as New
- Bookmark
- Subscribe
- Mute
- Subscribe to RSS Feed
- Permalink
RAJ,
So a sub type and a domain are handled differently in the code so are you really wanting the type (from the subtype of a field) or are you dealing with a field that only has a domain assigned?
- Mark as New
- Bookmark
- Subscribe
- Mute
- Subscribe to RSS Feed
- Permalink
RAJ,
In that case then here is some code to get the subtype name instead of the value:
let pUrl = "https://services.arcgis.com/V6ZHFr6zdgNZuVG0/ArcGIS/rest/services/2012_CA_NHTSA/FeatureServer/0";
let pFL = new FeatureLayer({
url: pUrl,
outFields:['*']
});
let qUVp= new Query({
returnGeometry: false,
where: '1=1',
returnDistinctValues: true,
outFields: ['sex'],
orderByFields: ['sex ASC']
});
pFL.queryFeatures(qUVp).then(function(results){
arrayUtils.map(results.features, function(feat){
let opt2 = document.createElement('option');
opt2.value = feat.attributes.sex;
opt2.innerHTML = pFL.getFeatureType(feat).name;
peakdd.appendChild(opt2);
});
});- Mark as New
- Bookmark
- Subscribe
- Mute
- Subscribe to RSS Feed
- Permalink
ok so right now am using,
let qSubType = new Query({
returnGeometry: false,
where: '1=1',
returnDistinctValues: true,
outFields: ['SUBTYPE'],
orderByFields: ['SUBTYPE ASC']
});
qTask.execute(qSubType).then(function(results) {
results.features.map(function(feat) {
let opt3 = document.createElement('option');
opt3.value = feat.attributes.SUBTYPE;
opt3.innerHTML = feat.attributes.SUBTYPE;
subdd.appendChild(opt);
});
view.graphic.add(selectedGraphics);
});
GetFeatureType retrives description..?
- Mark as New
- Bookmark
- Subscribe
- Mute
- Subscribe to RSS Feed
- Permalink
getFeatureType(feature) returns a FeatureType then you have to get the name property from that.
- Mark as New
- Bookmark
- Subscribe
- Mute
- Subscribe to RSS Feed
- Permalink
ok.. got it..I'll try by considering this above snippet.. can you give me one example for domain also.. So can you share any example or snippet if we dealing with domain values instead of subtype.